Correction (July 23, 2026): An earlier version said Bismarck's 2024 chronic absence rate was 21% and that the Fargo-West Fargo gap was essentially zero in 2018. Bismarck's 2024 rate is 16%, and the 2018 gap was 6 percentage points.
In a state where 86% of districts have not recovered to their pre-pandemic chronic absenteeism levels, West Fargo is doing something right.
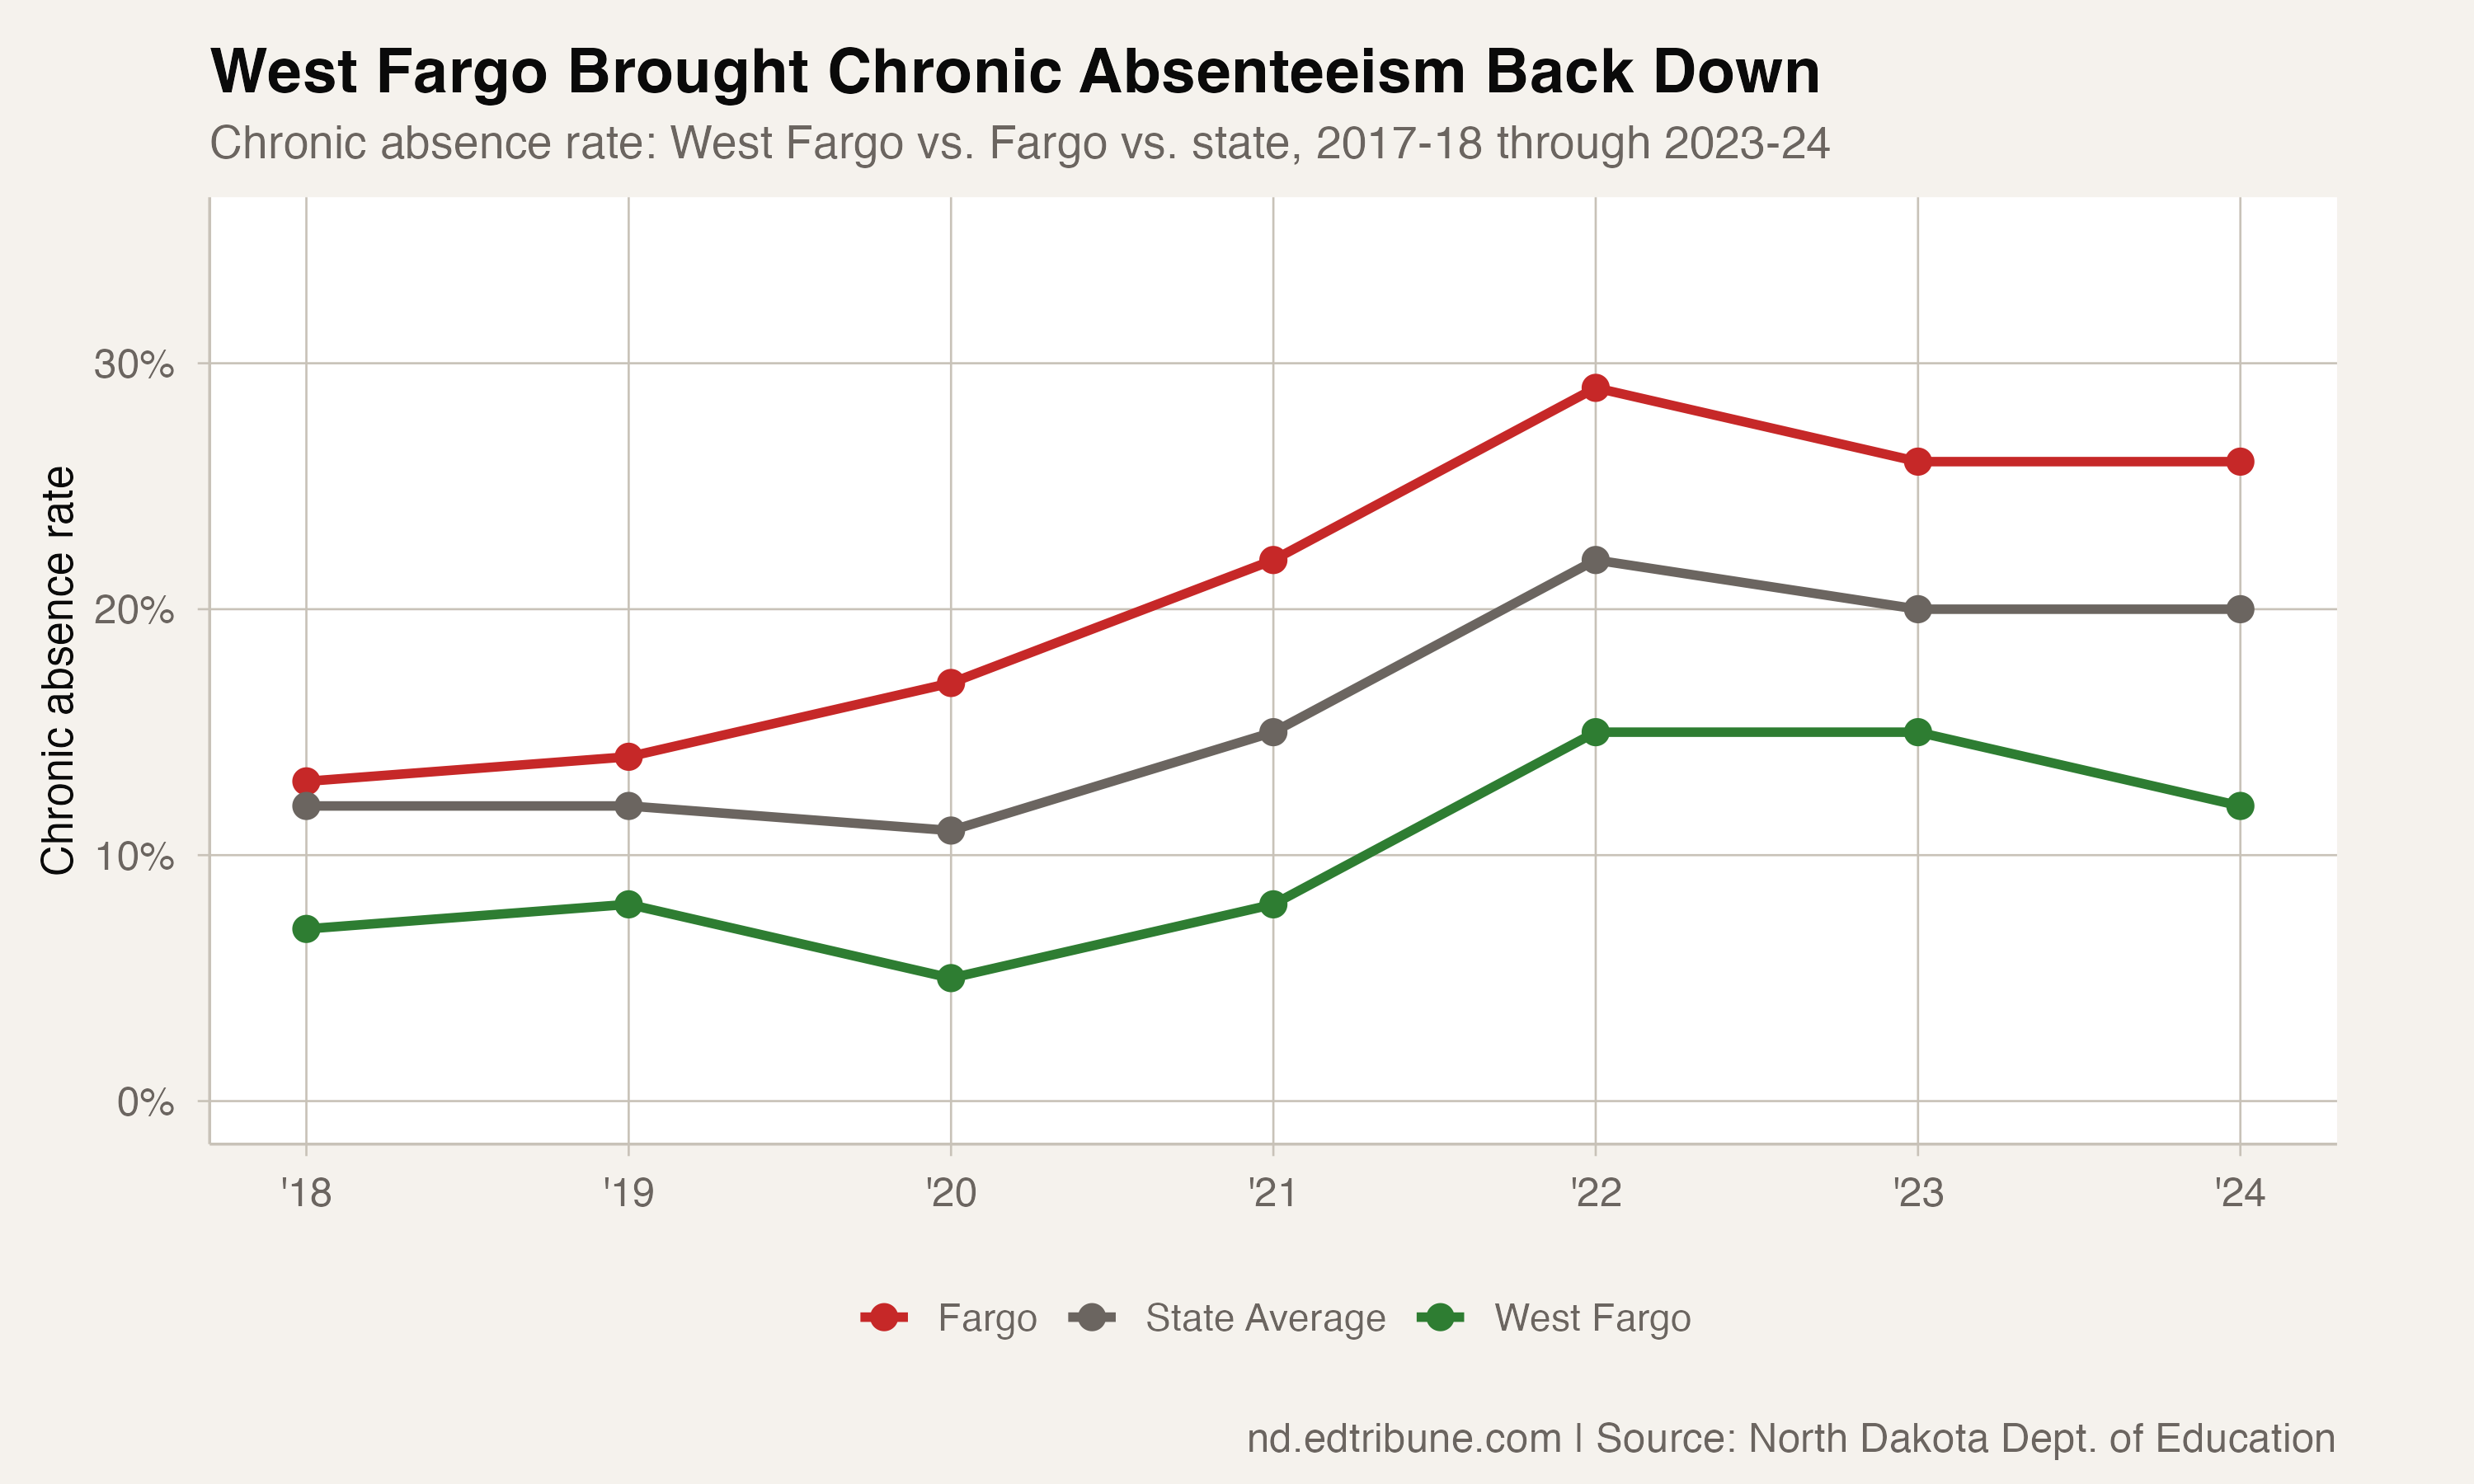
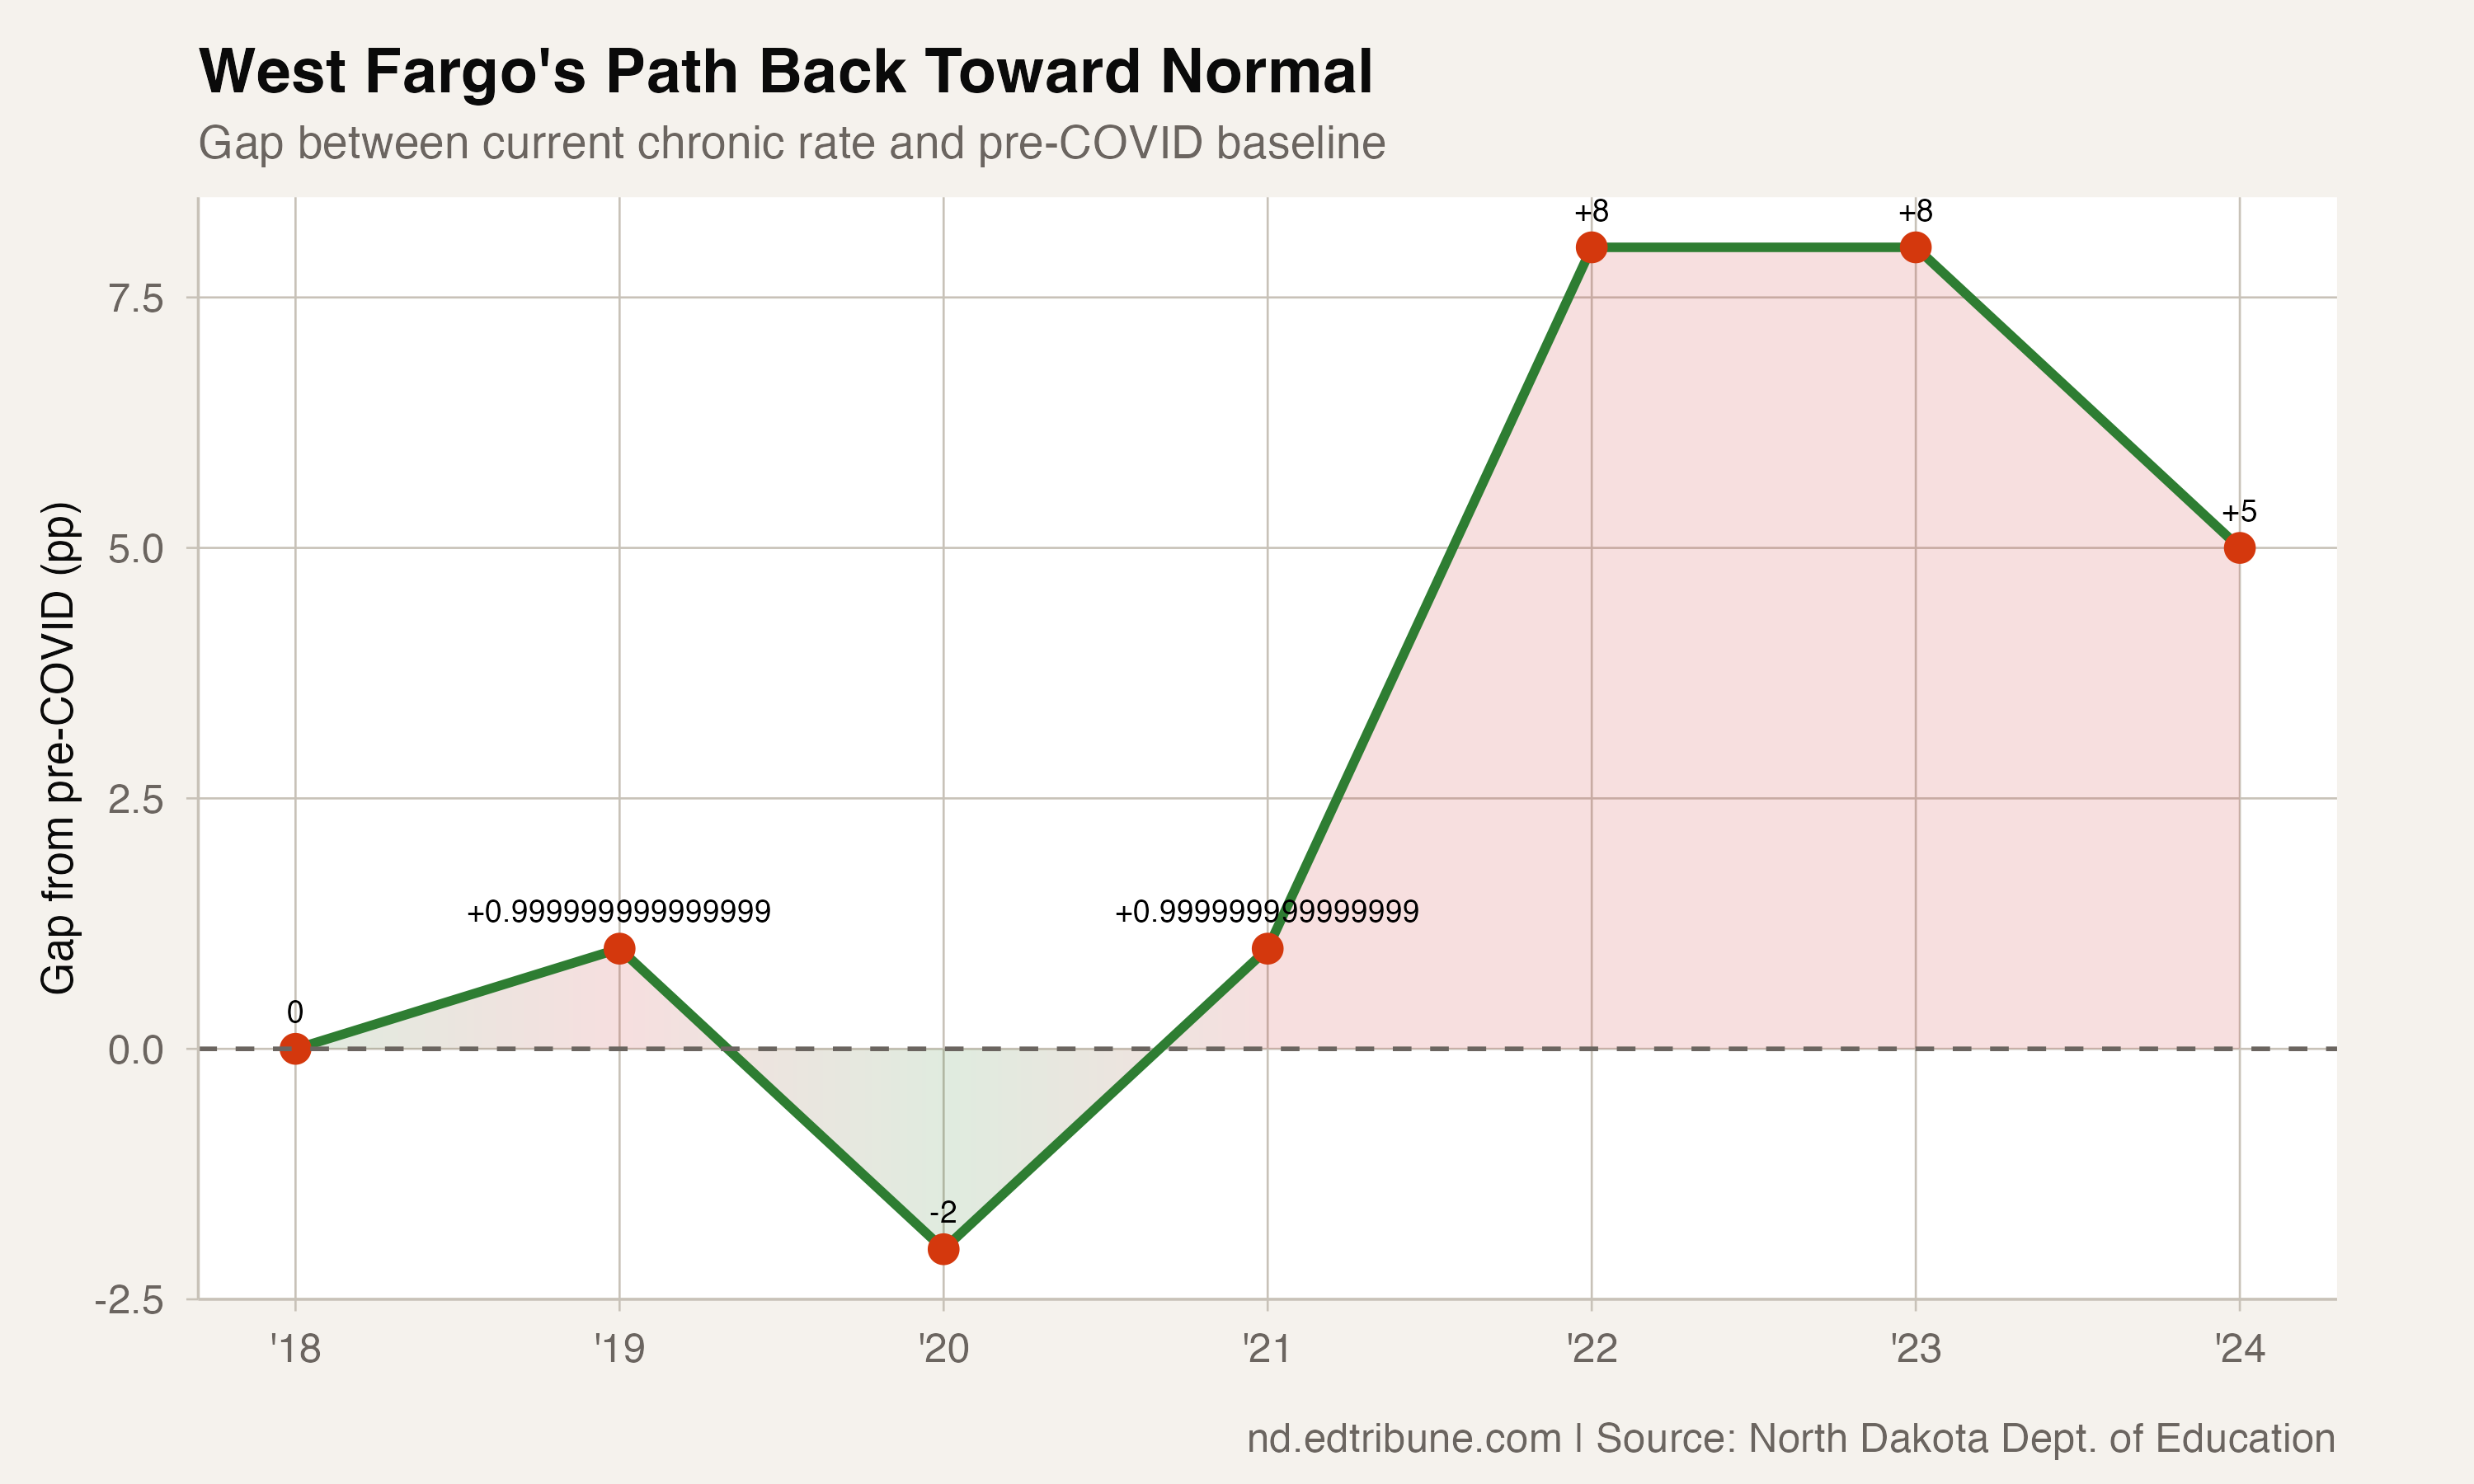
The state's fastest-growing district brought its chronic absence rate from a peak of 15% in 2021-22 down to 12% in 2023-24, approaching its pre-COVID level of 7-8%. And mid-year 2024-25 data shows the district at just 3.3%, a figure that, if it holds through the full school year, would represent a complete recovery and then some.
The neighbor contrast
The comparison with Fargo is inescapable. The two districts share a metropolitan area, separated by a municipal boundary rather than any meaningful geographic barrier. Families on adjacent streets may attend different districts. Yet their attendance trajectories have diverged dramatically.
Fargo's chronic rate doubled from 13% to 26%. West Fargo's peaked at 15% and has come back down to 12%. The gap between them went from 6 percentage points in 2018 to 14 percentage points in 2024.
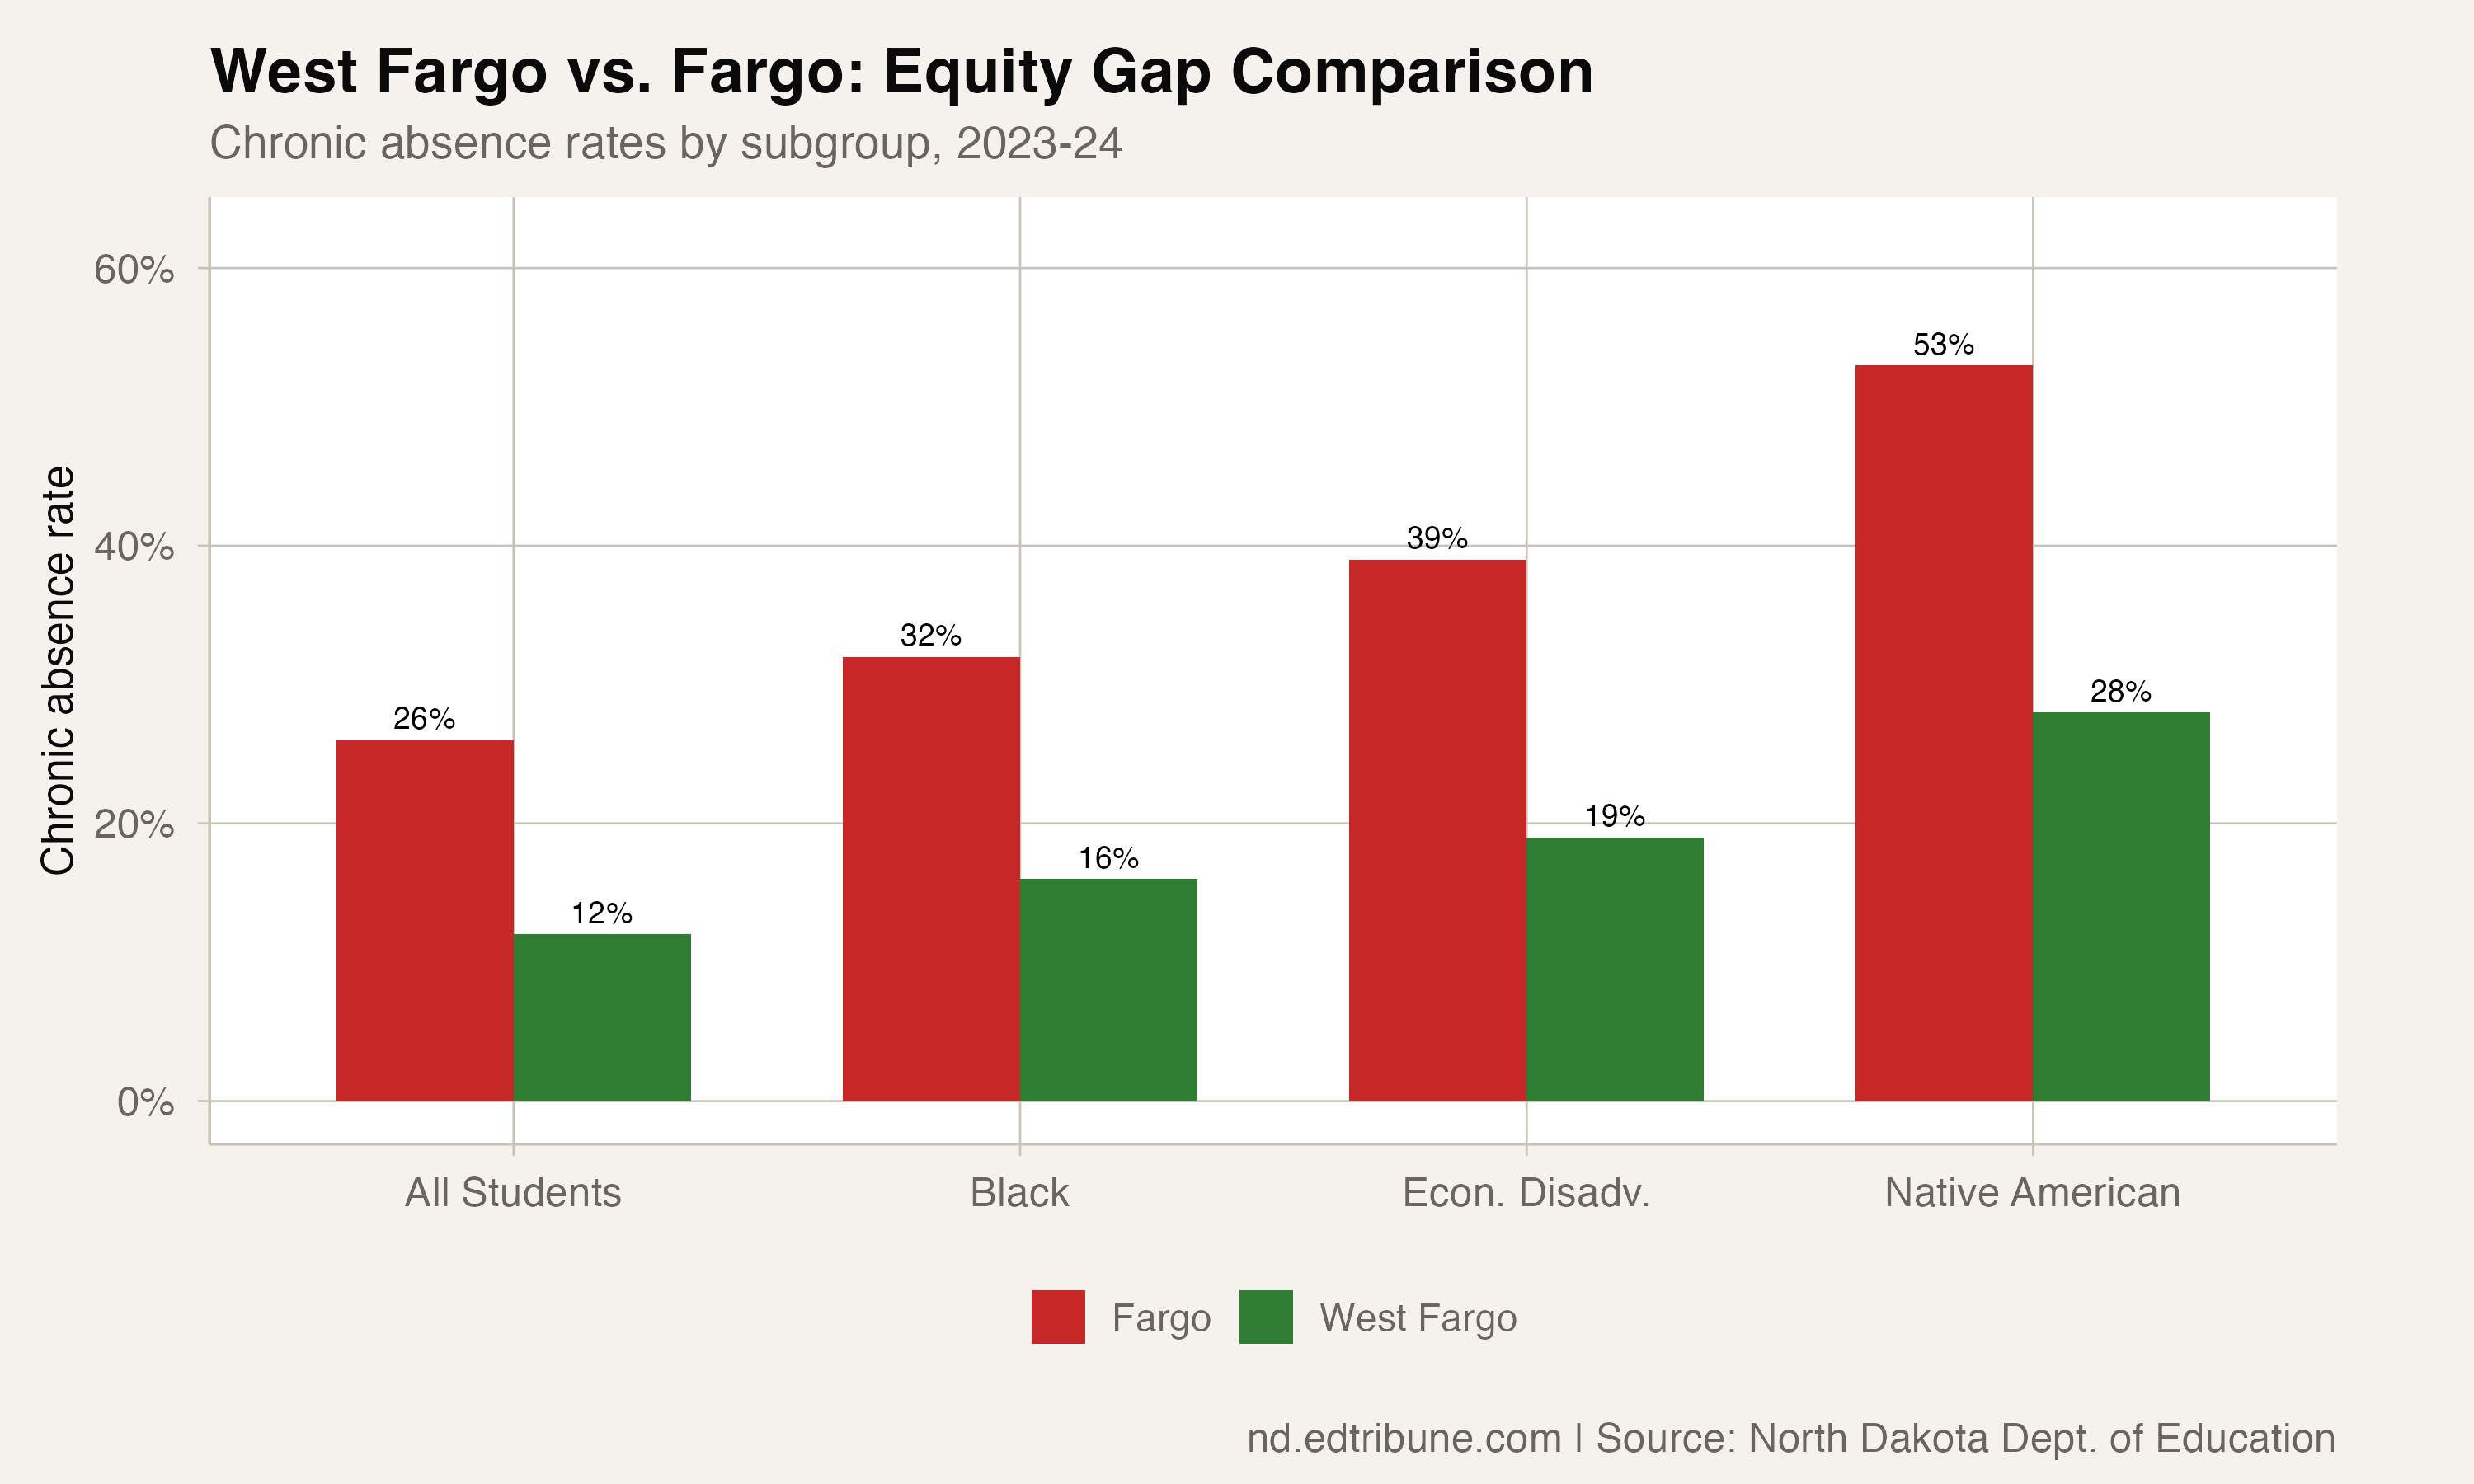
The divergence extends to subgroup rates. West Fargo's Black students have a 16% chronic rate in 2024; Fargo's Black students are at 32%. West Fargo's Native American students are at 28%; Fargo's are at 53%. West Fargo's economically disadvantaged students sit at 19%; Fargo's at 39%.
Why the gap?
West Fargo is a newer, faster-growing district with newer school buildings. It draws families who actively chose the community, which may correlate with higher engagement. And it has a smaller percentage of students from the most disadvantaged backgrounds.
But demographics do not explain the full gap. West Fargo's Black students have half the chronic rate of Fargo's Black students. The district is achieving better outcomes within comparable subgroups, not just across them. Something about how West Fargo runs its schools is producing different results.
The big four in context
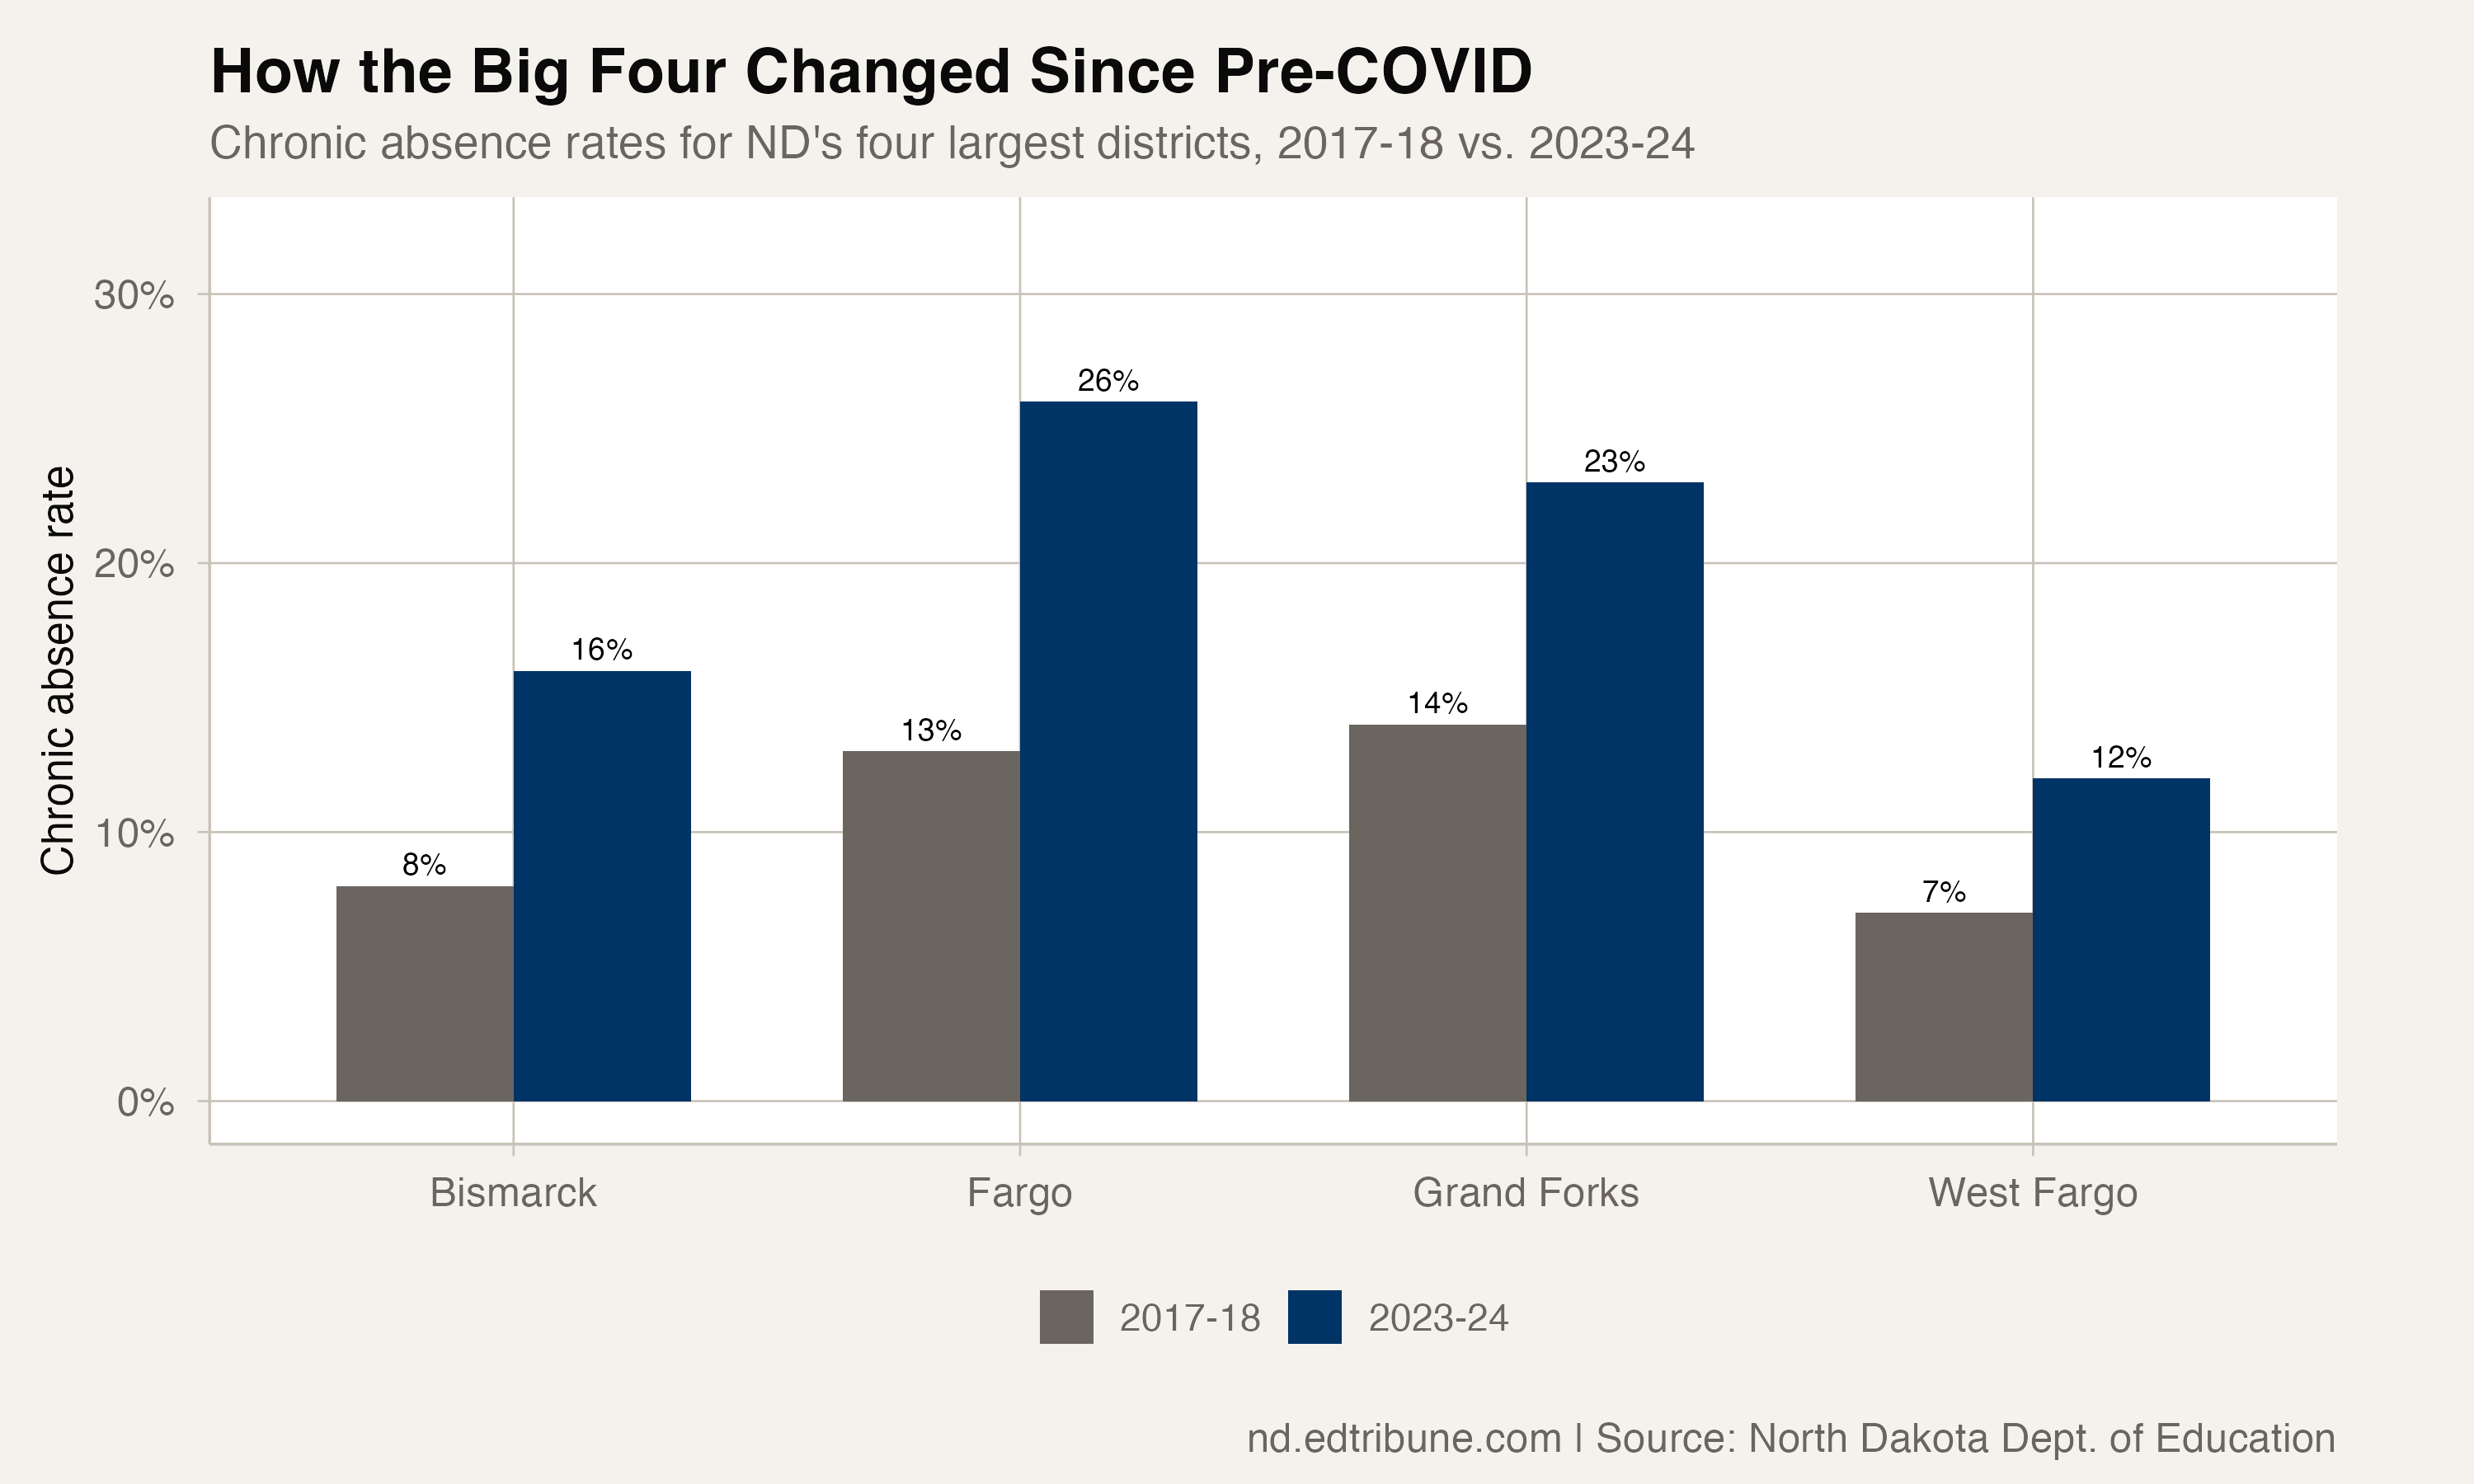
Among North Dakota's four largest districts, the spread in chronic absenteeism is striking. West Fargo at 12% and Fargo at 26% represent the extremes. Bismarck sits at 16% and Grand Forks at 23%, though Grand Forks improved 4 points in 2024 after implementing a new attendance policy.
Districts within the same metro area, the same labor market, and the same state can produce very different attendance results. West Fargo's 3.3% mid-year figure for 2024-25 should be treated as a snapshot until full-year NDDPI data confirms it -- mid-year counts tend to be lower since some students have not yet crossed the chronic threshold. But the trajectory is clear, and whatever West Fargo is doing differently is worth studying closely.
Detailed code that reproduces the analysis and figures in this article is available exclusively to EdTribune subscribers.
Discussion
Sign in to join the discussion.
Loading comments...