Correction (2026-05-04): A previous version of this article asserted that "every racial equity gap" in North Dakota chronic absenteeism had widened since the pandemic. That was wrong: the Asian-white gap did not widen, and Asian students now show a slightly lower chronic absence rate than white students. The previous version also used pre-pandemic rates (white 12%, Native American 33%, Hispanic peak 41%) that do not appear in the state attendance data; the correct rates from fetch_absence() are white 9% (2019) → 17% (peak 2022) → 15% (2024); Native American 30% → 44% → 39%; Hispanic 24% → 36% → 35%. This version corrects those errors and reframes the recovery story.
Native American students in North Dakota cut their chronic absence rate from 44% at the 2022 pandemic peak to 39% in 2023-24, a five-point decline, the largest peak-to-current drop of any racial group in the state. White students, by comparison, recovered just two points from their peak.
But that recovery wasn't enough to narrow the gap. Native American students entered the pandemic with a chronic absence rate already 21 points higher than white students. COVID stretched the gap to 27 points at the peak. The recovery has it back at 24 points, still wider than 2019, just less wide than 2022.
That pattern (a real recovery, just not big enough to outpace the pandemic's uneven impact) applies to most groups in the state. Four of the five racial gaps with white students remain wider than they were before COVID. The exception is striking, and gets buried in a deficit-only telling: Asian students entered the pandemic at parity with white students, and the latest data has them about a point below.
Four of five gaps wider, one inverted
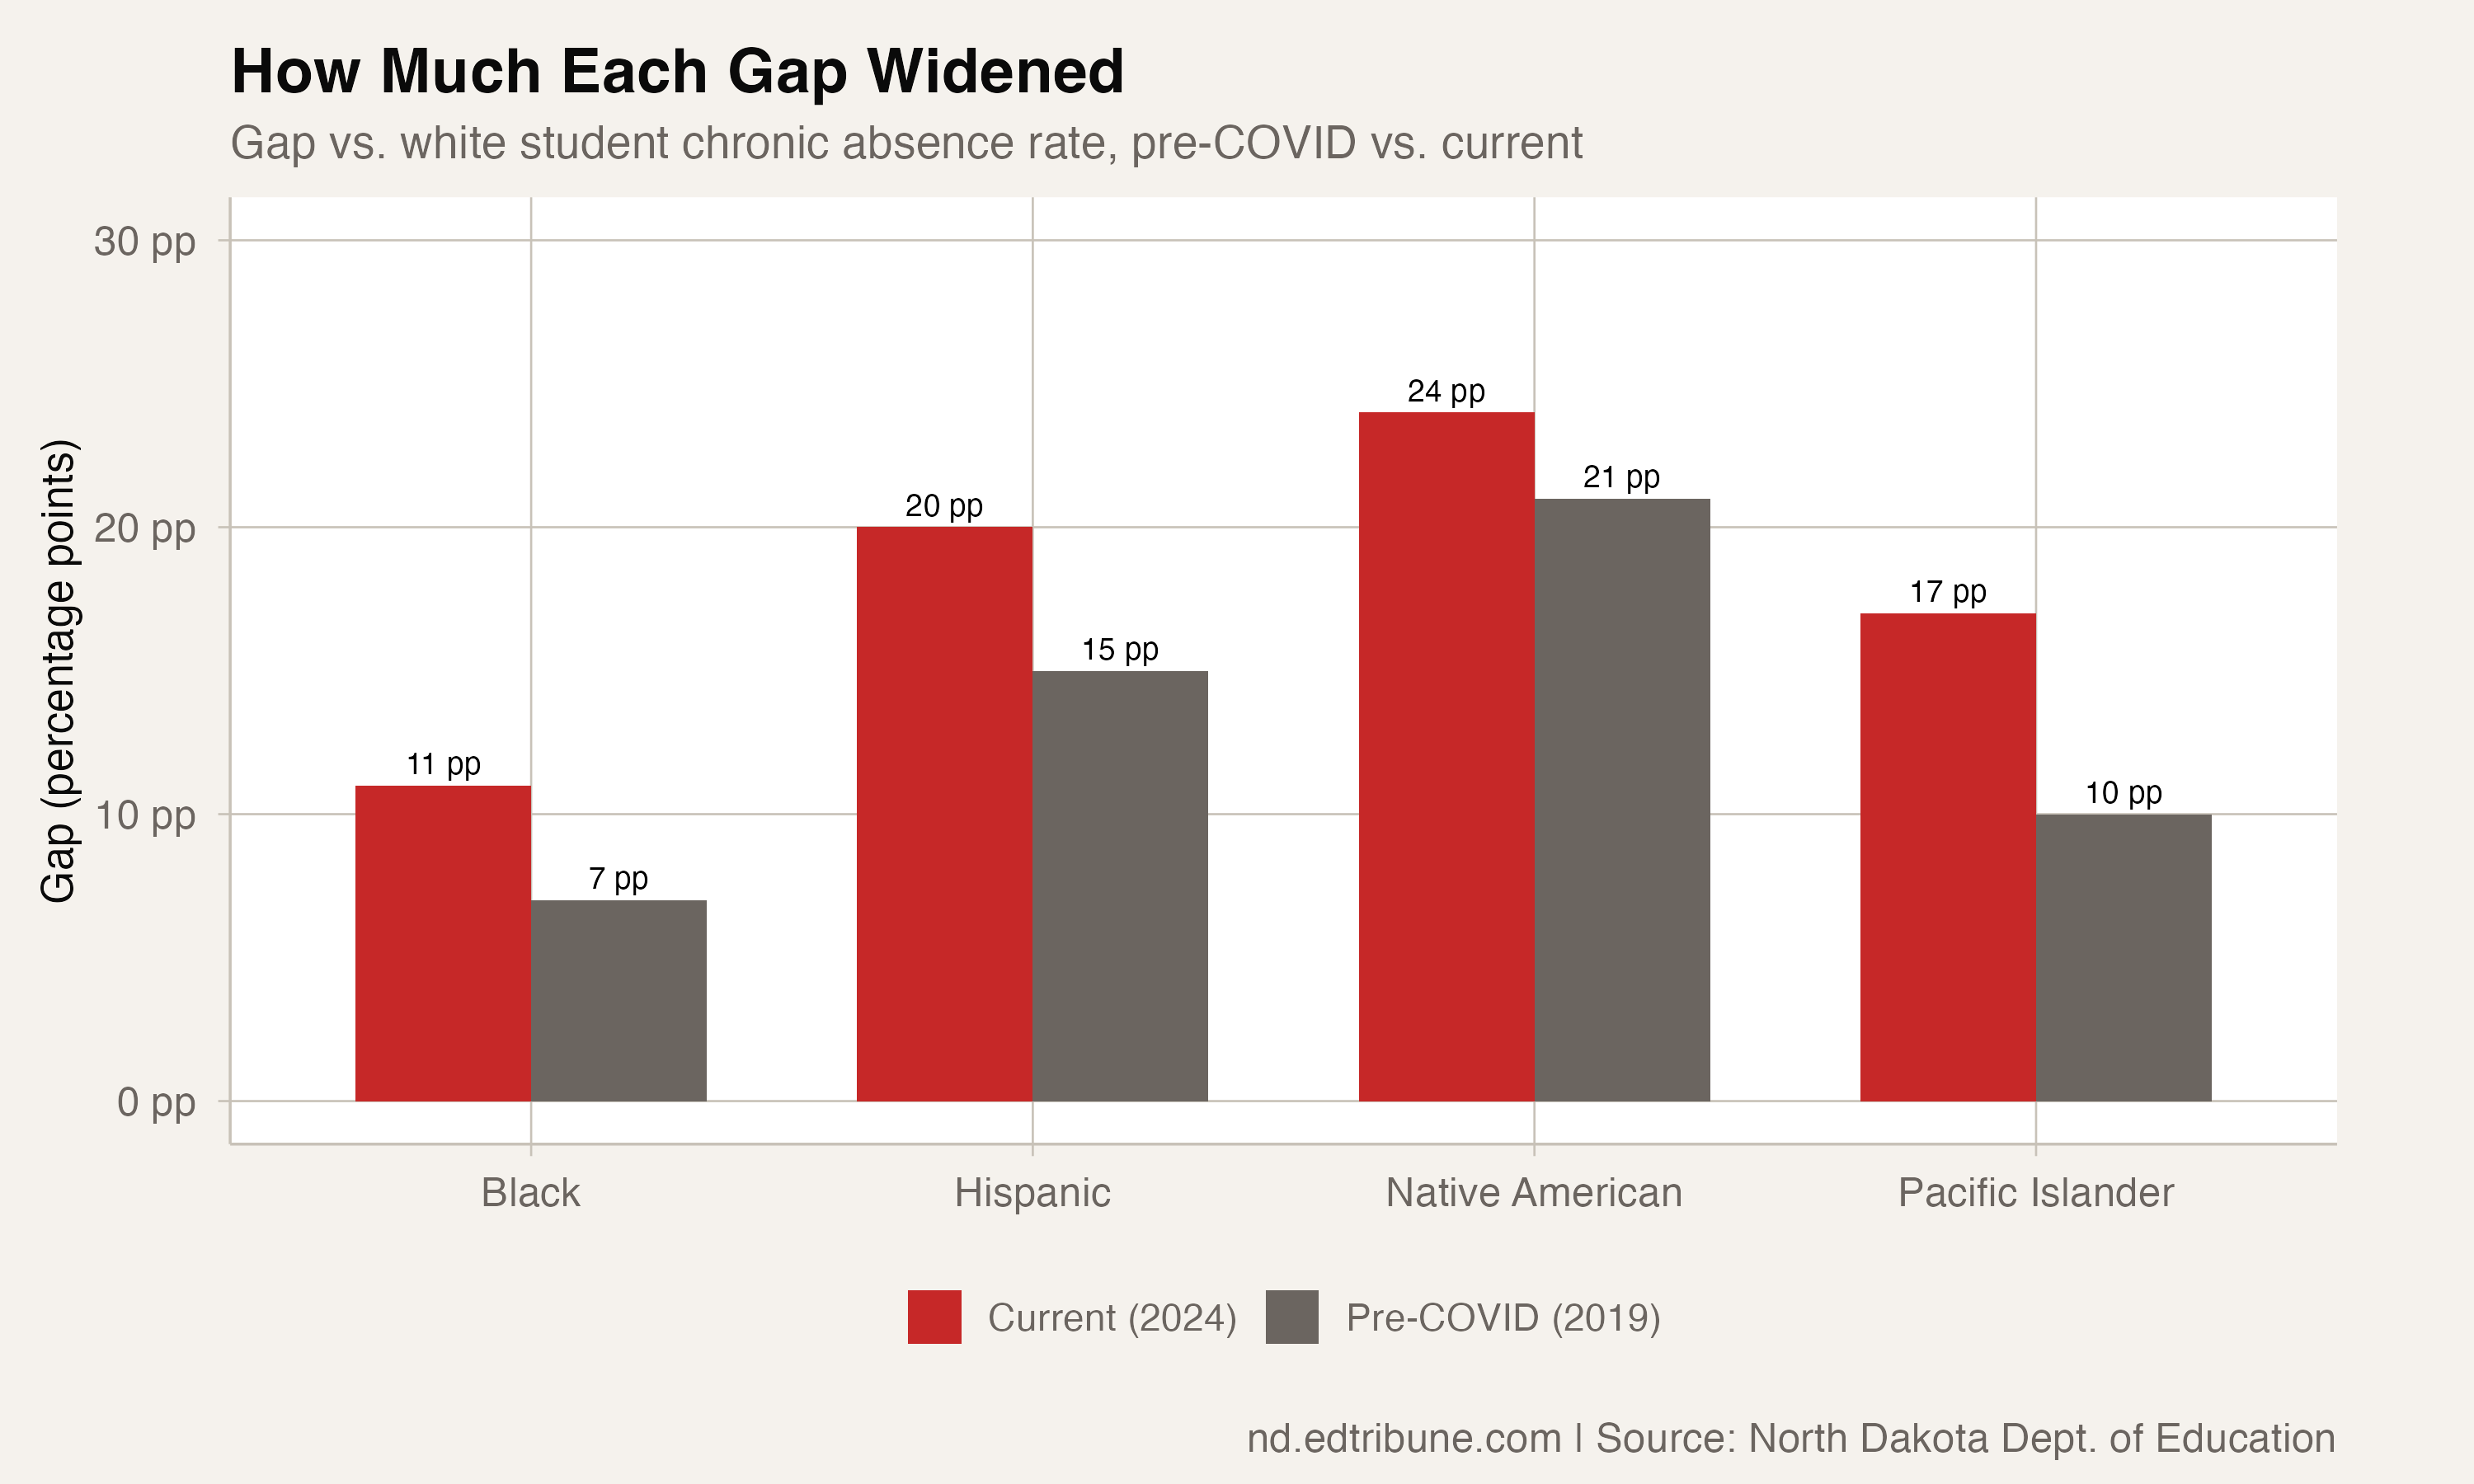
Comparing 2019 to 2023-24, the gaps with white students are:
- Native American-white: 21pp → 24pp (+3pp)
- Hispanic-white: 15pp → 20pp (+5pp)
- Black-white: 7pp → 11pp (+4pp)
- Pacific Islander-white: 10pp → 17pp (+7pp, the largest expansion)
- Asian-white: 0pp → -1pp (the only contraction)
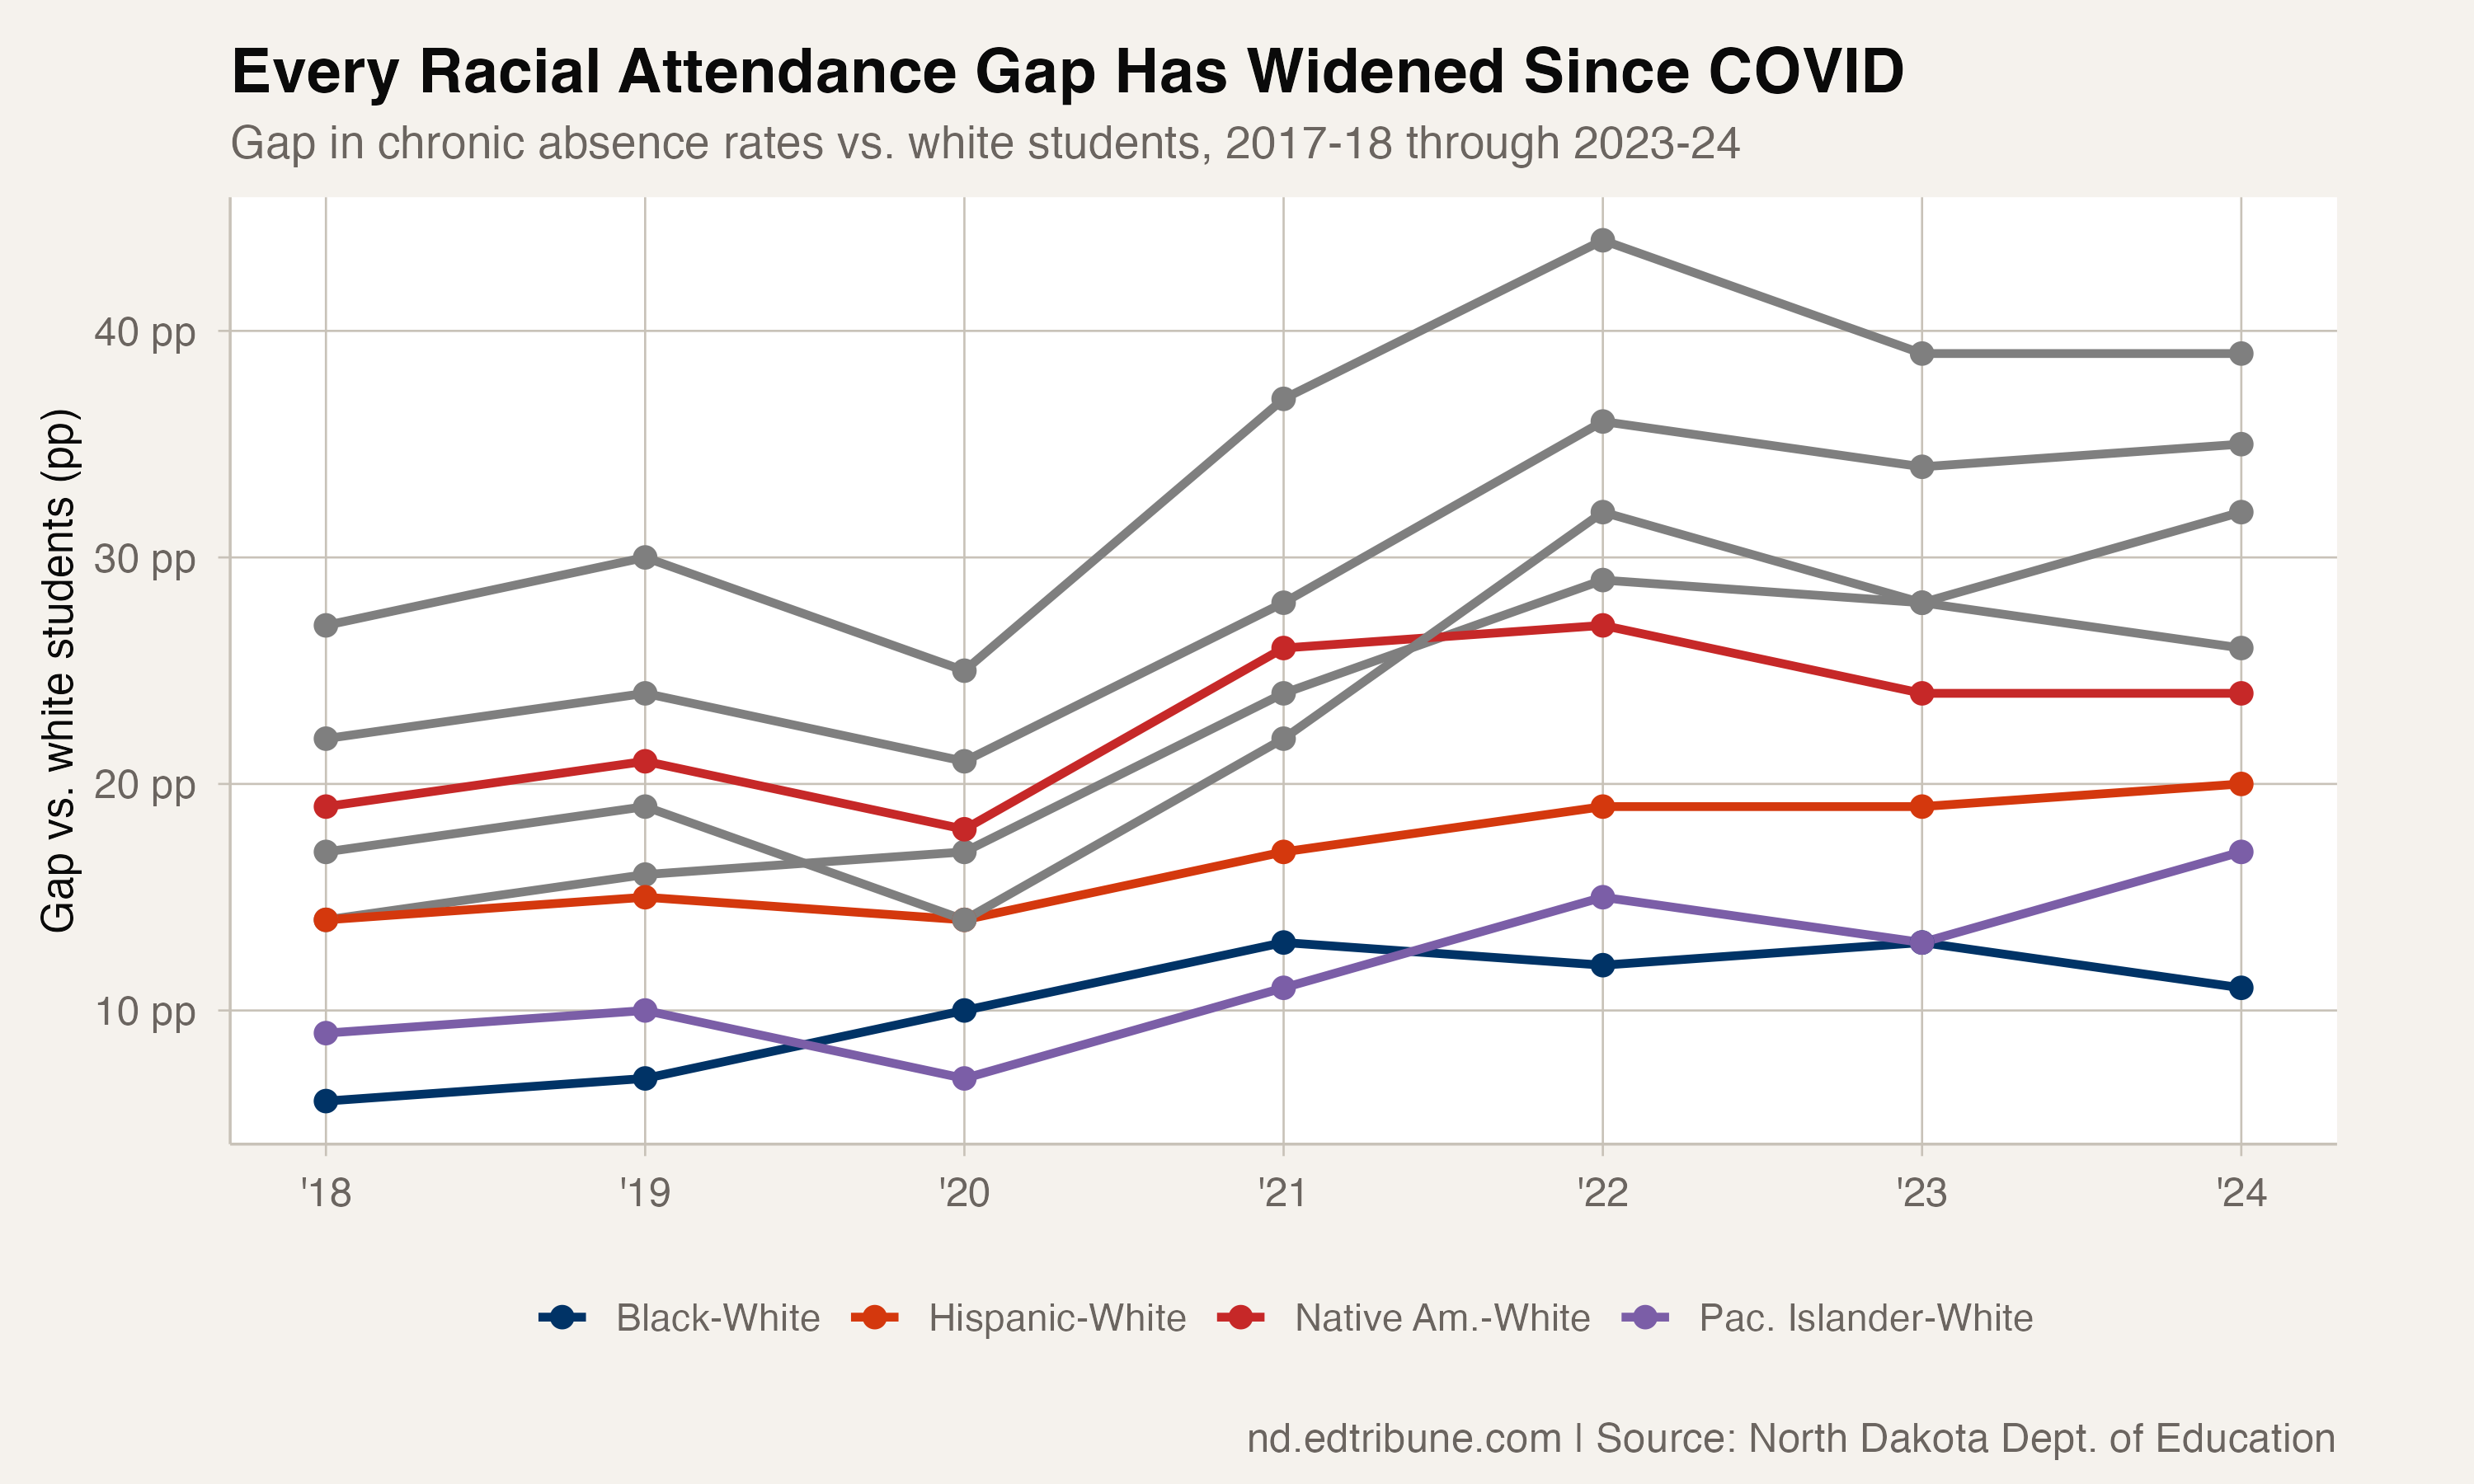
A consistent expansion in four of five gaps cannot be dismissed as random year-over-year drift. The post-pandemic period has not been kind to attendance equity in North Dakota.
The recovery is real, just uneven
Look at peak-to-current improvement, and a different texture appears beneath the gap-widening summary. Some groups have recovered substantially from their pandemic peaks. Others have barely moved.
- Native American: 30% (2019) → 44% (2022 peak) → 39% (2024). Five points off the peak; about a third of the way back to 2019.
- Black: 16% → 29% → 26%. Three points off the peak; about a quarter of the way back.
- White: 9% → 17% → 15%. Two points off the peak; about a quarter of the way back.
- Hispanic: 24% → 36% → 35%. One point off the peak; less than 10% of the way back.
- Pacific Islander: 19% → 32% → 32%. No recovery from the peak. The rate has held steady at its pandemic high for two consecutive years.
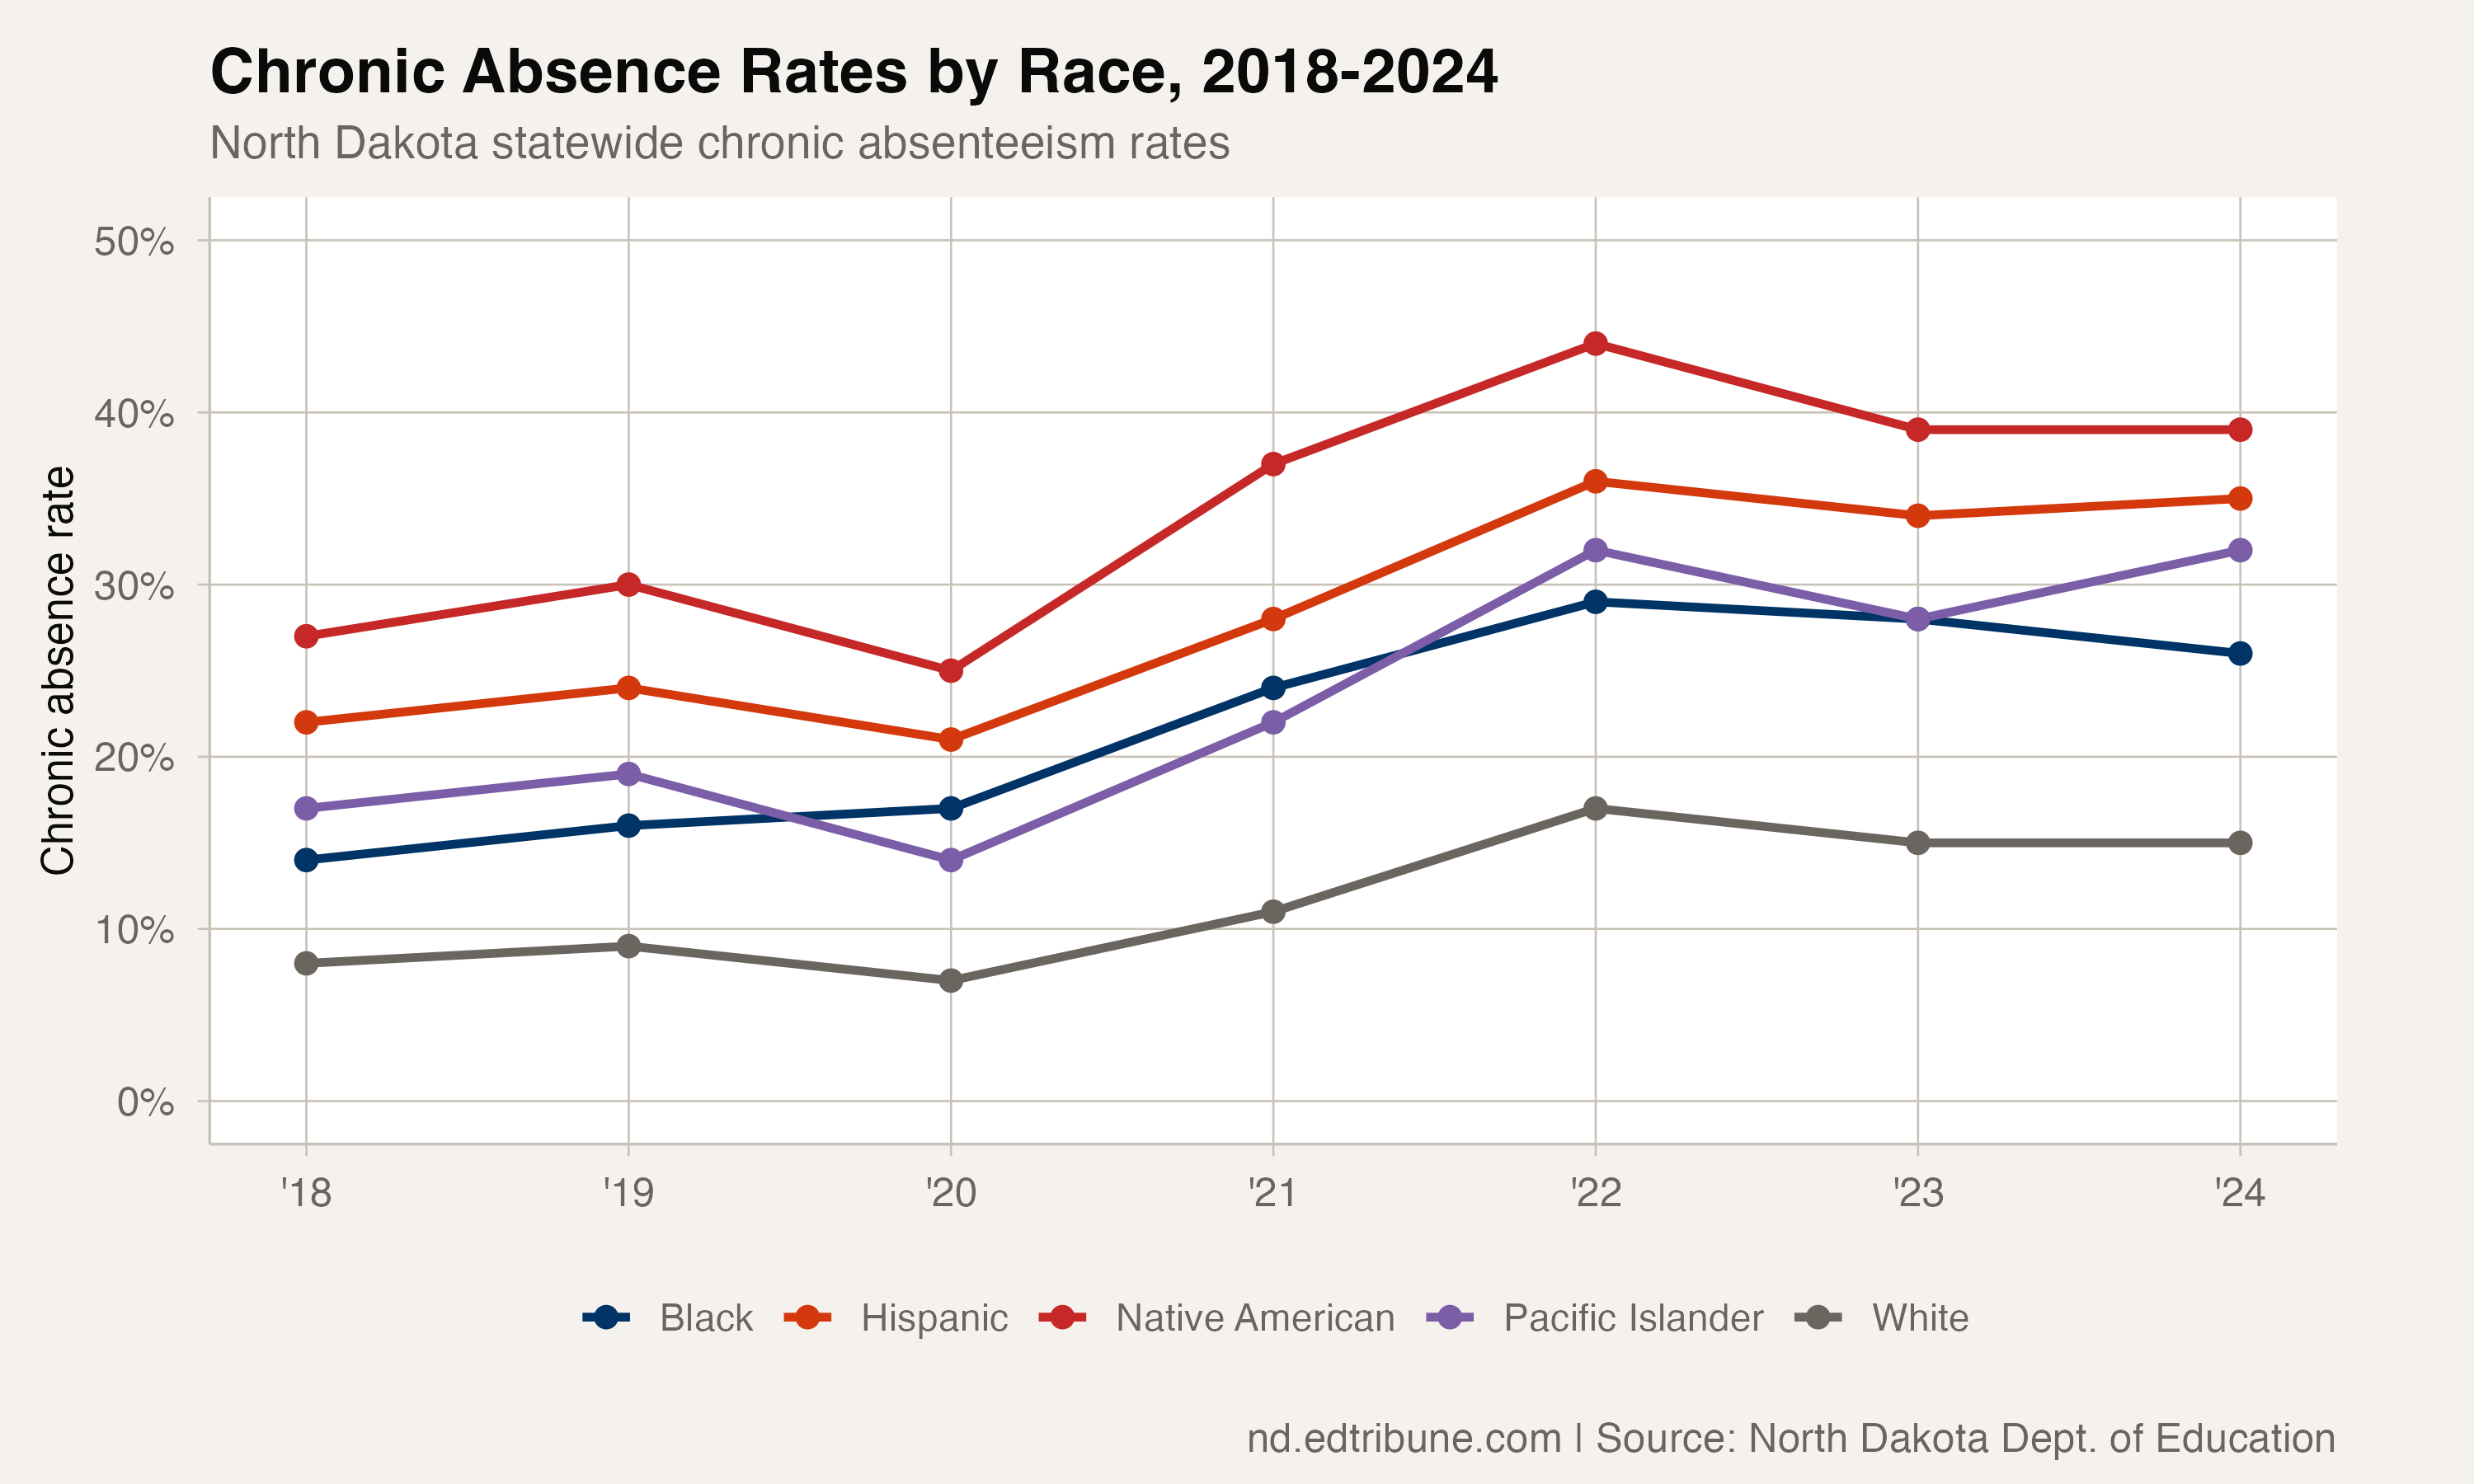
Native American students showed the largest absolute recovery from peak of any racial group in the state. The framing that "white students captured more of the improvement" is not what the rate trajectories show. The framing that fits the data is closer to: COVID hit the groups already at higher rates harder, and even sizable recoveries among those groups have not closed the gaps.
Hispanic students and Pacific Islander students stand out as the groups whose recovery has stalled. For Pacific Islander students, though the population in North Dakota is small, the rate has not moved off its 2022 high.
What 24 points means
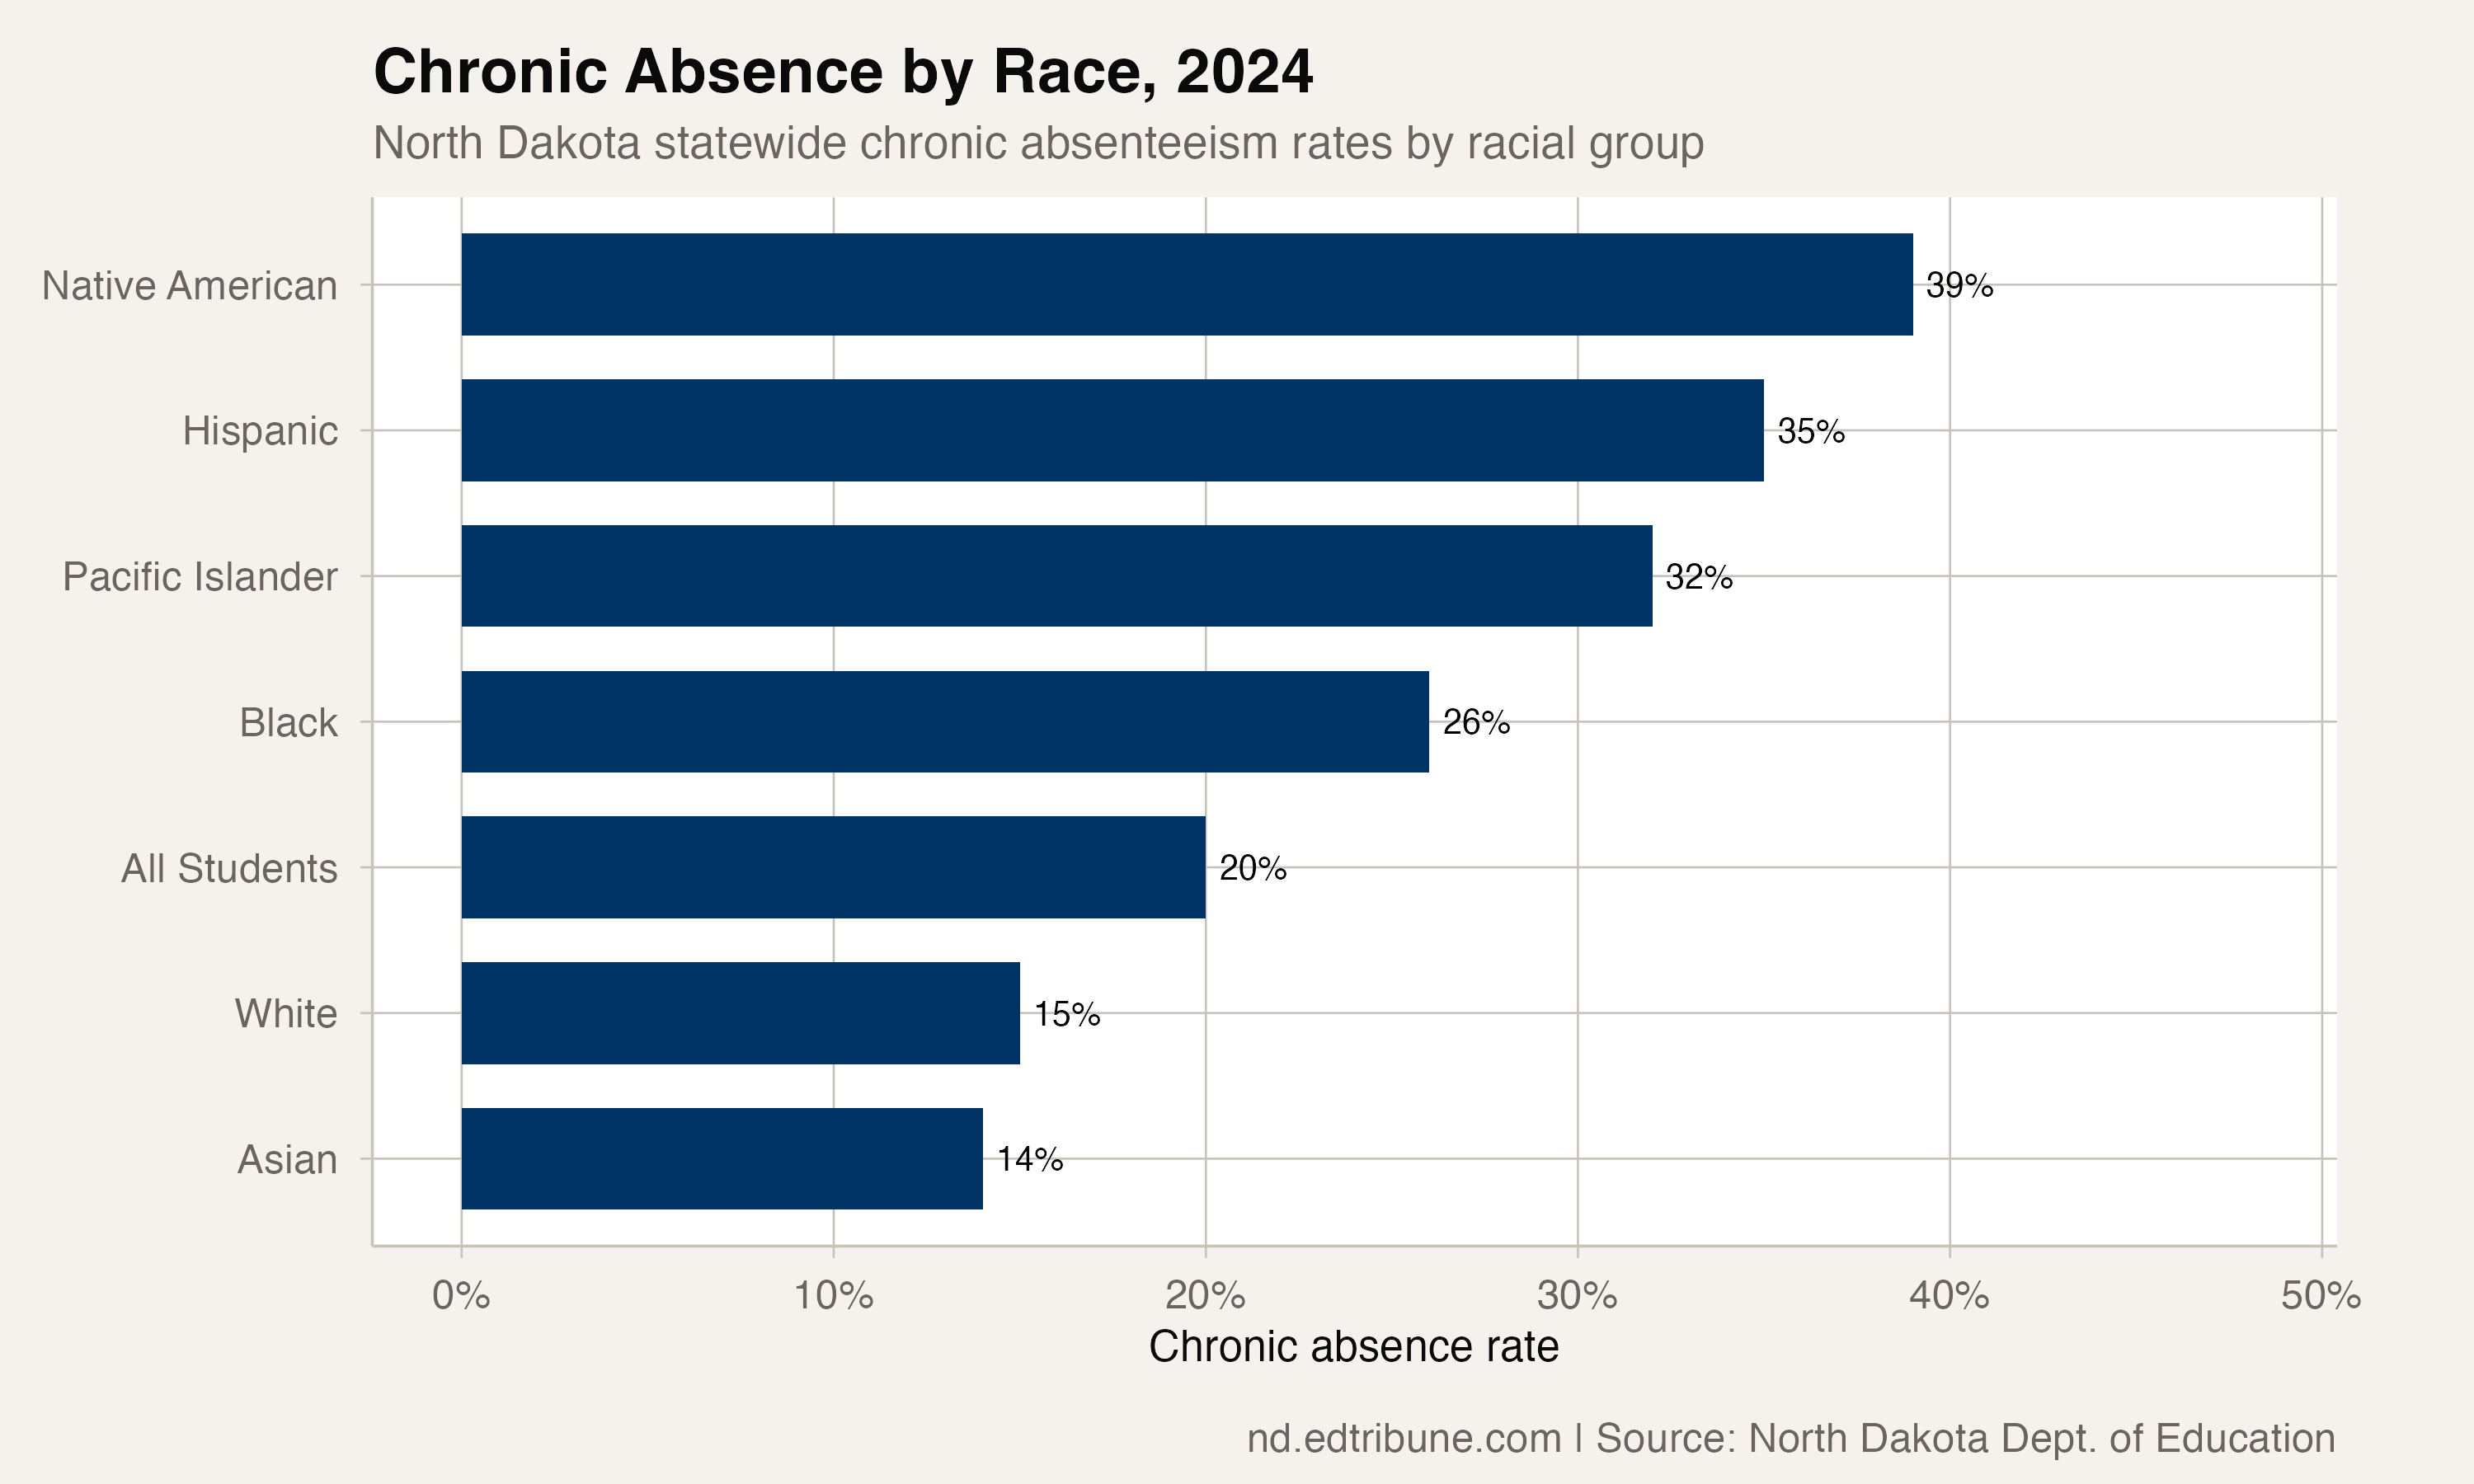
The 24-point Native American-white gap means that in two classrooms side by side, one predominantly Native American and one predominantly white, the Native American classroom would have roughly two and a half times as many students who are chronically absent. The Hispanic-white gap of 20 points is nearly as severe.
These are not abstract statistical differences. They translate directly into different amounts of instructional time received, different levels of social connection to school, and different probabilities of academic struggle. Research consistently finds that students who are chronically absent are less likely to read at grade level, more likely to drop out, and more likely to experience poverty as adults.
North Dakota's attendance data does not include the intersection of race and poverty, so it is impossible to know how much of the racial gap reflects economic disparities versus factors specific to race. What the data shows is that the pandemic widened most existing inequities, that the post-pandemic period has been uneven across groups, that two groups (Native American and Black) have started recovering substantively from their peaks, and that two (Hispanic and Pacific Islander) have not. The Asian-white gap, alone, has gone the other way.
Treating chronic absenteeism as a single statewide problem with a single statewide rate is a choice. The data makes clear it is a choice that obscures very different recovery trajectories beneath the average.
Detailed code that reproduces the analysis and figures in this article is available exclusively to EdTribune subscribers.
Discussion
Sign in to join the discussion.
Loading comments...