One in four students in North Dakota's 2024 graduation cohort came from a low-income household. Roughly one in three of those students did not finish high school on time.
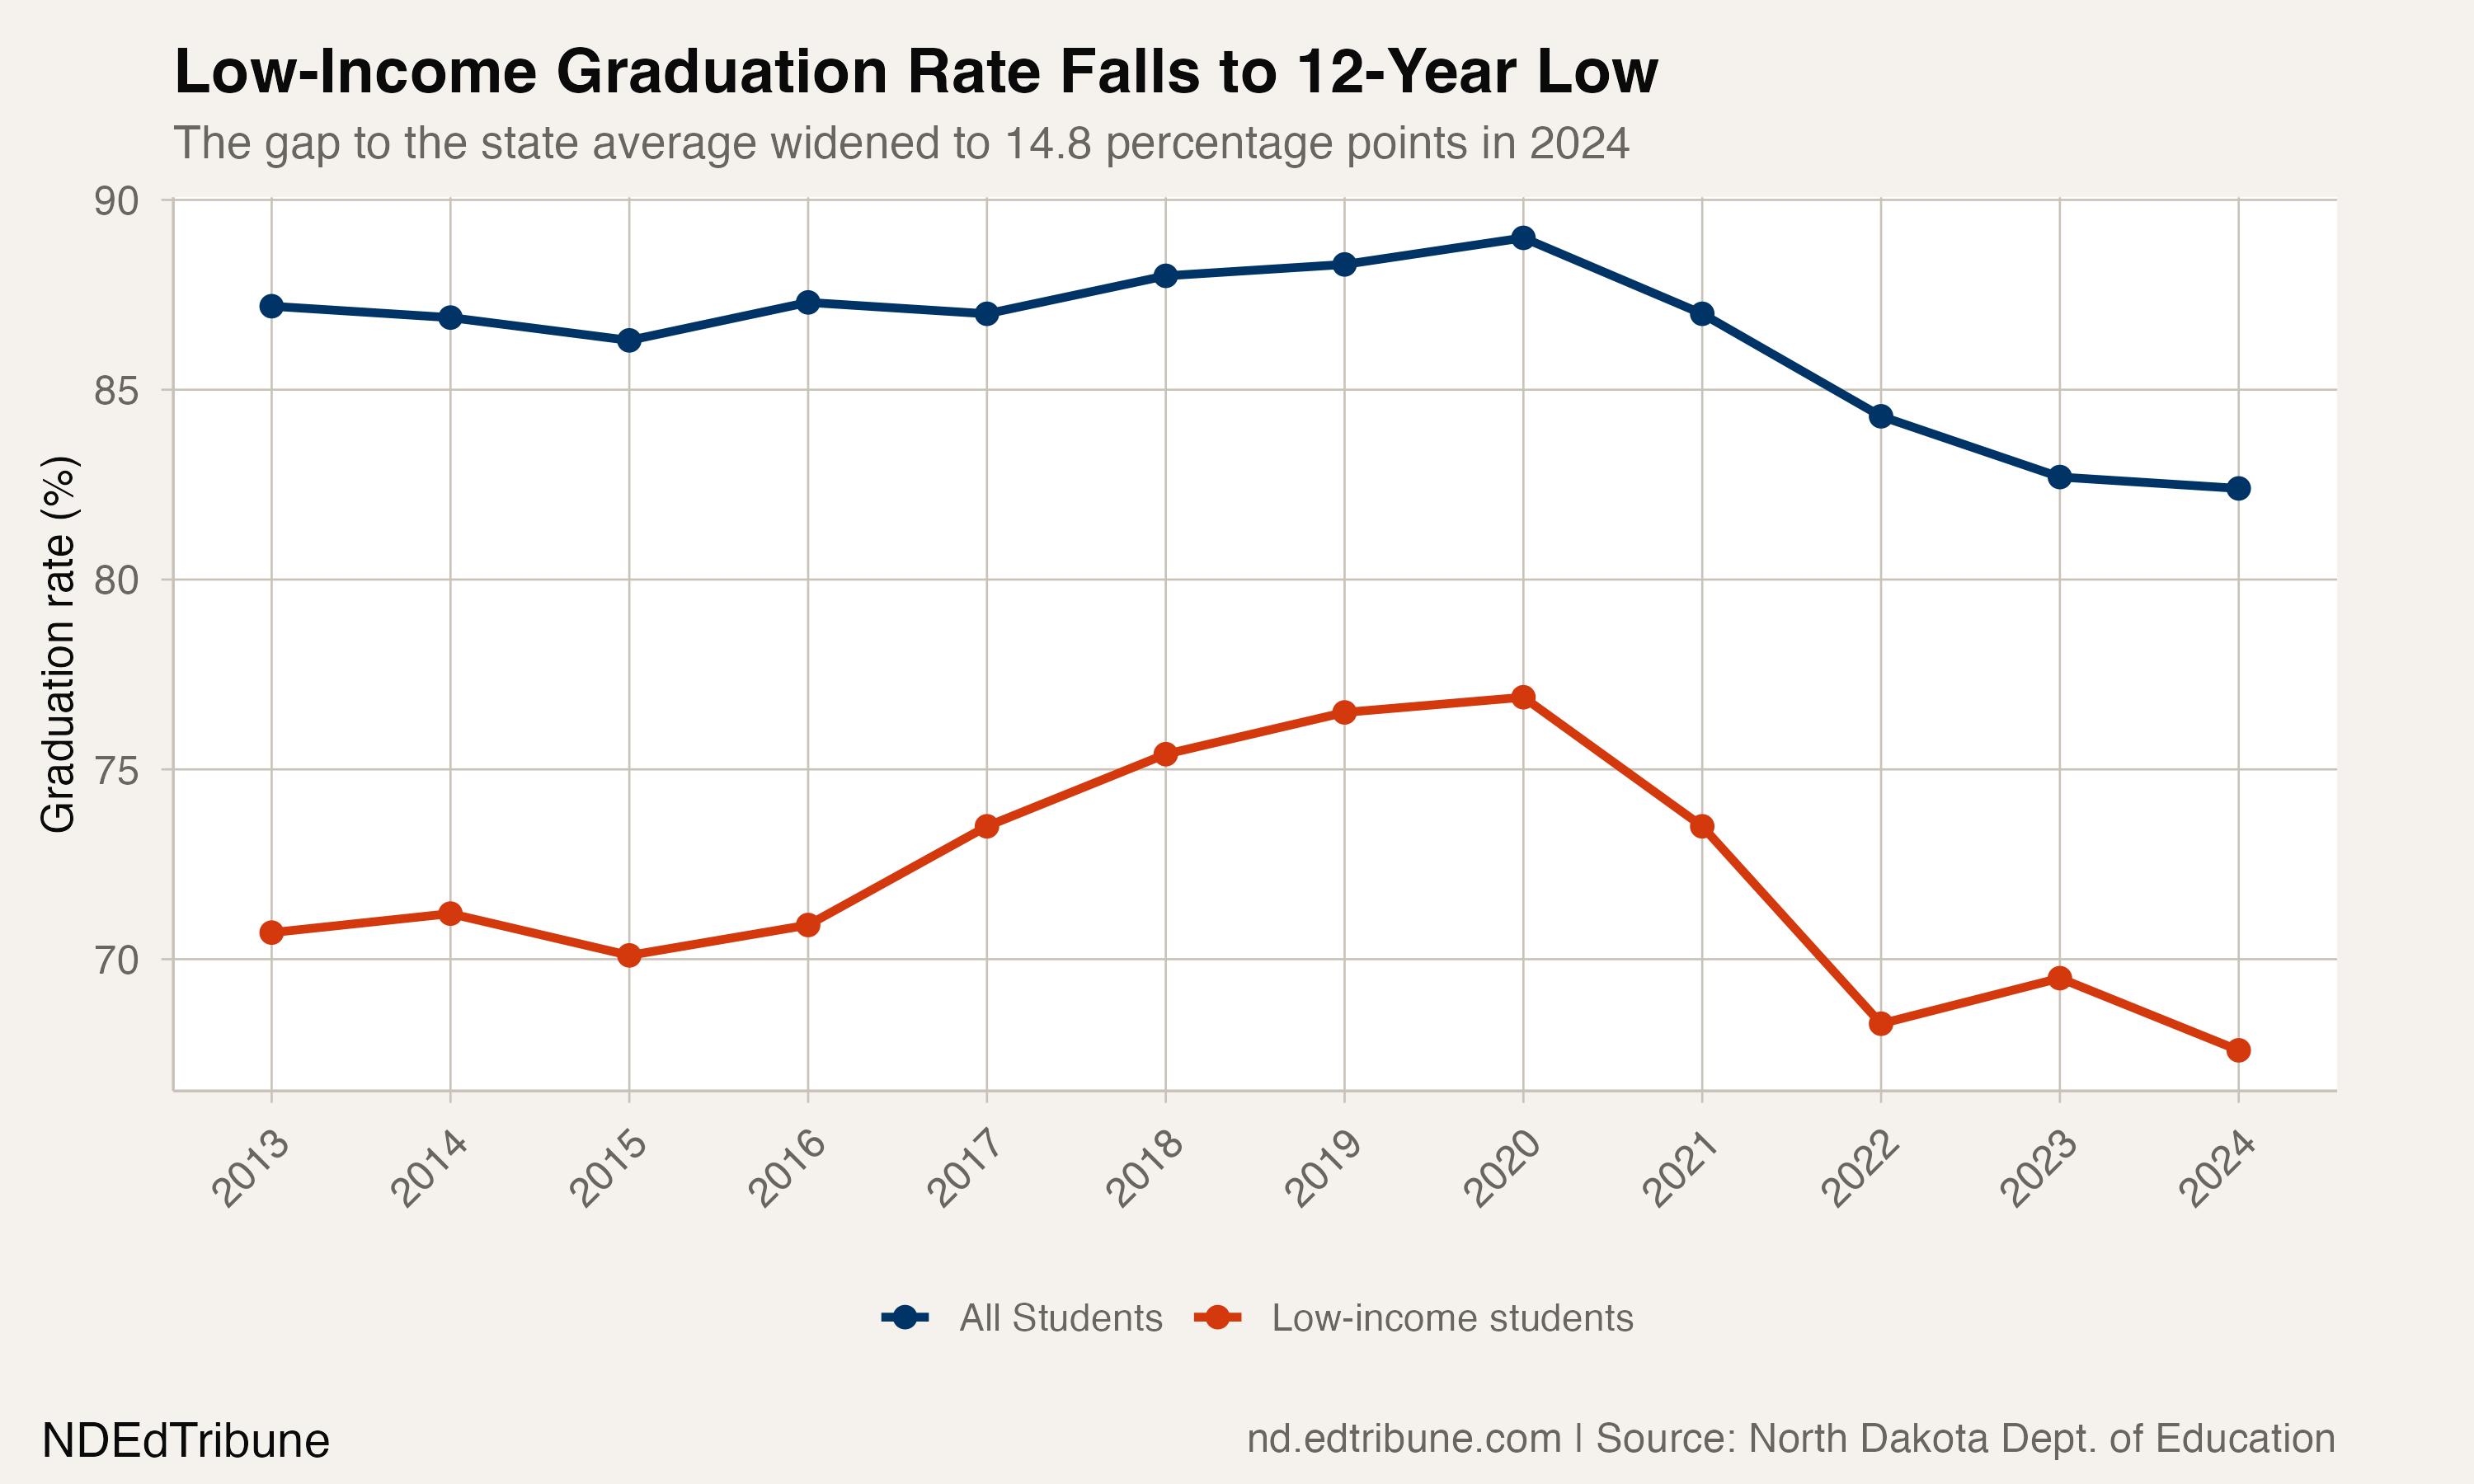
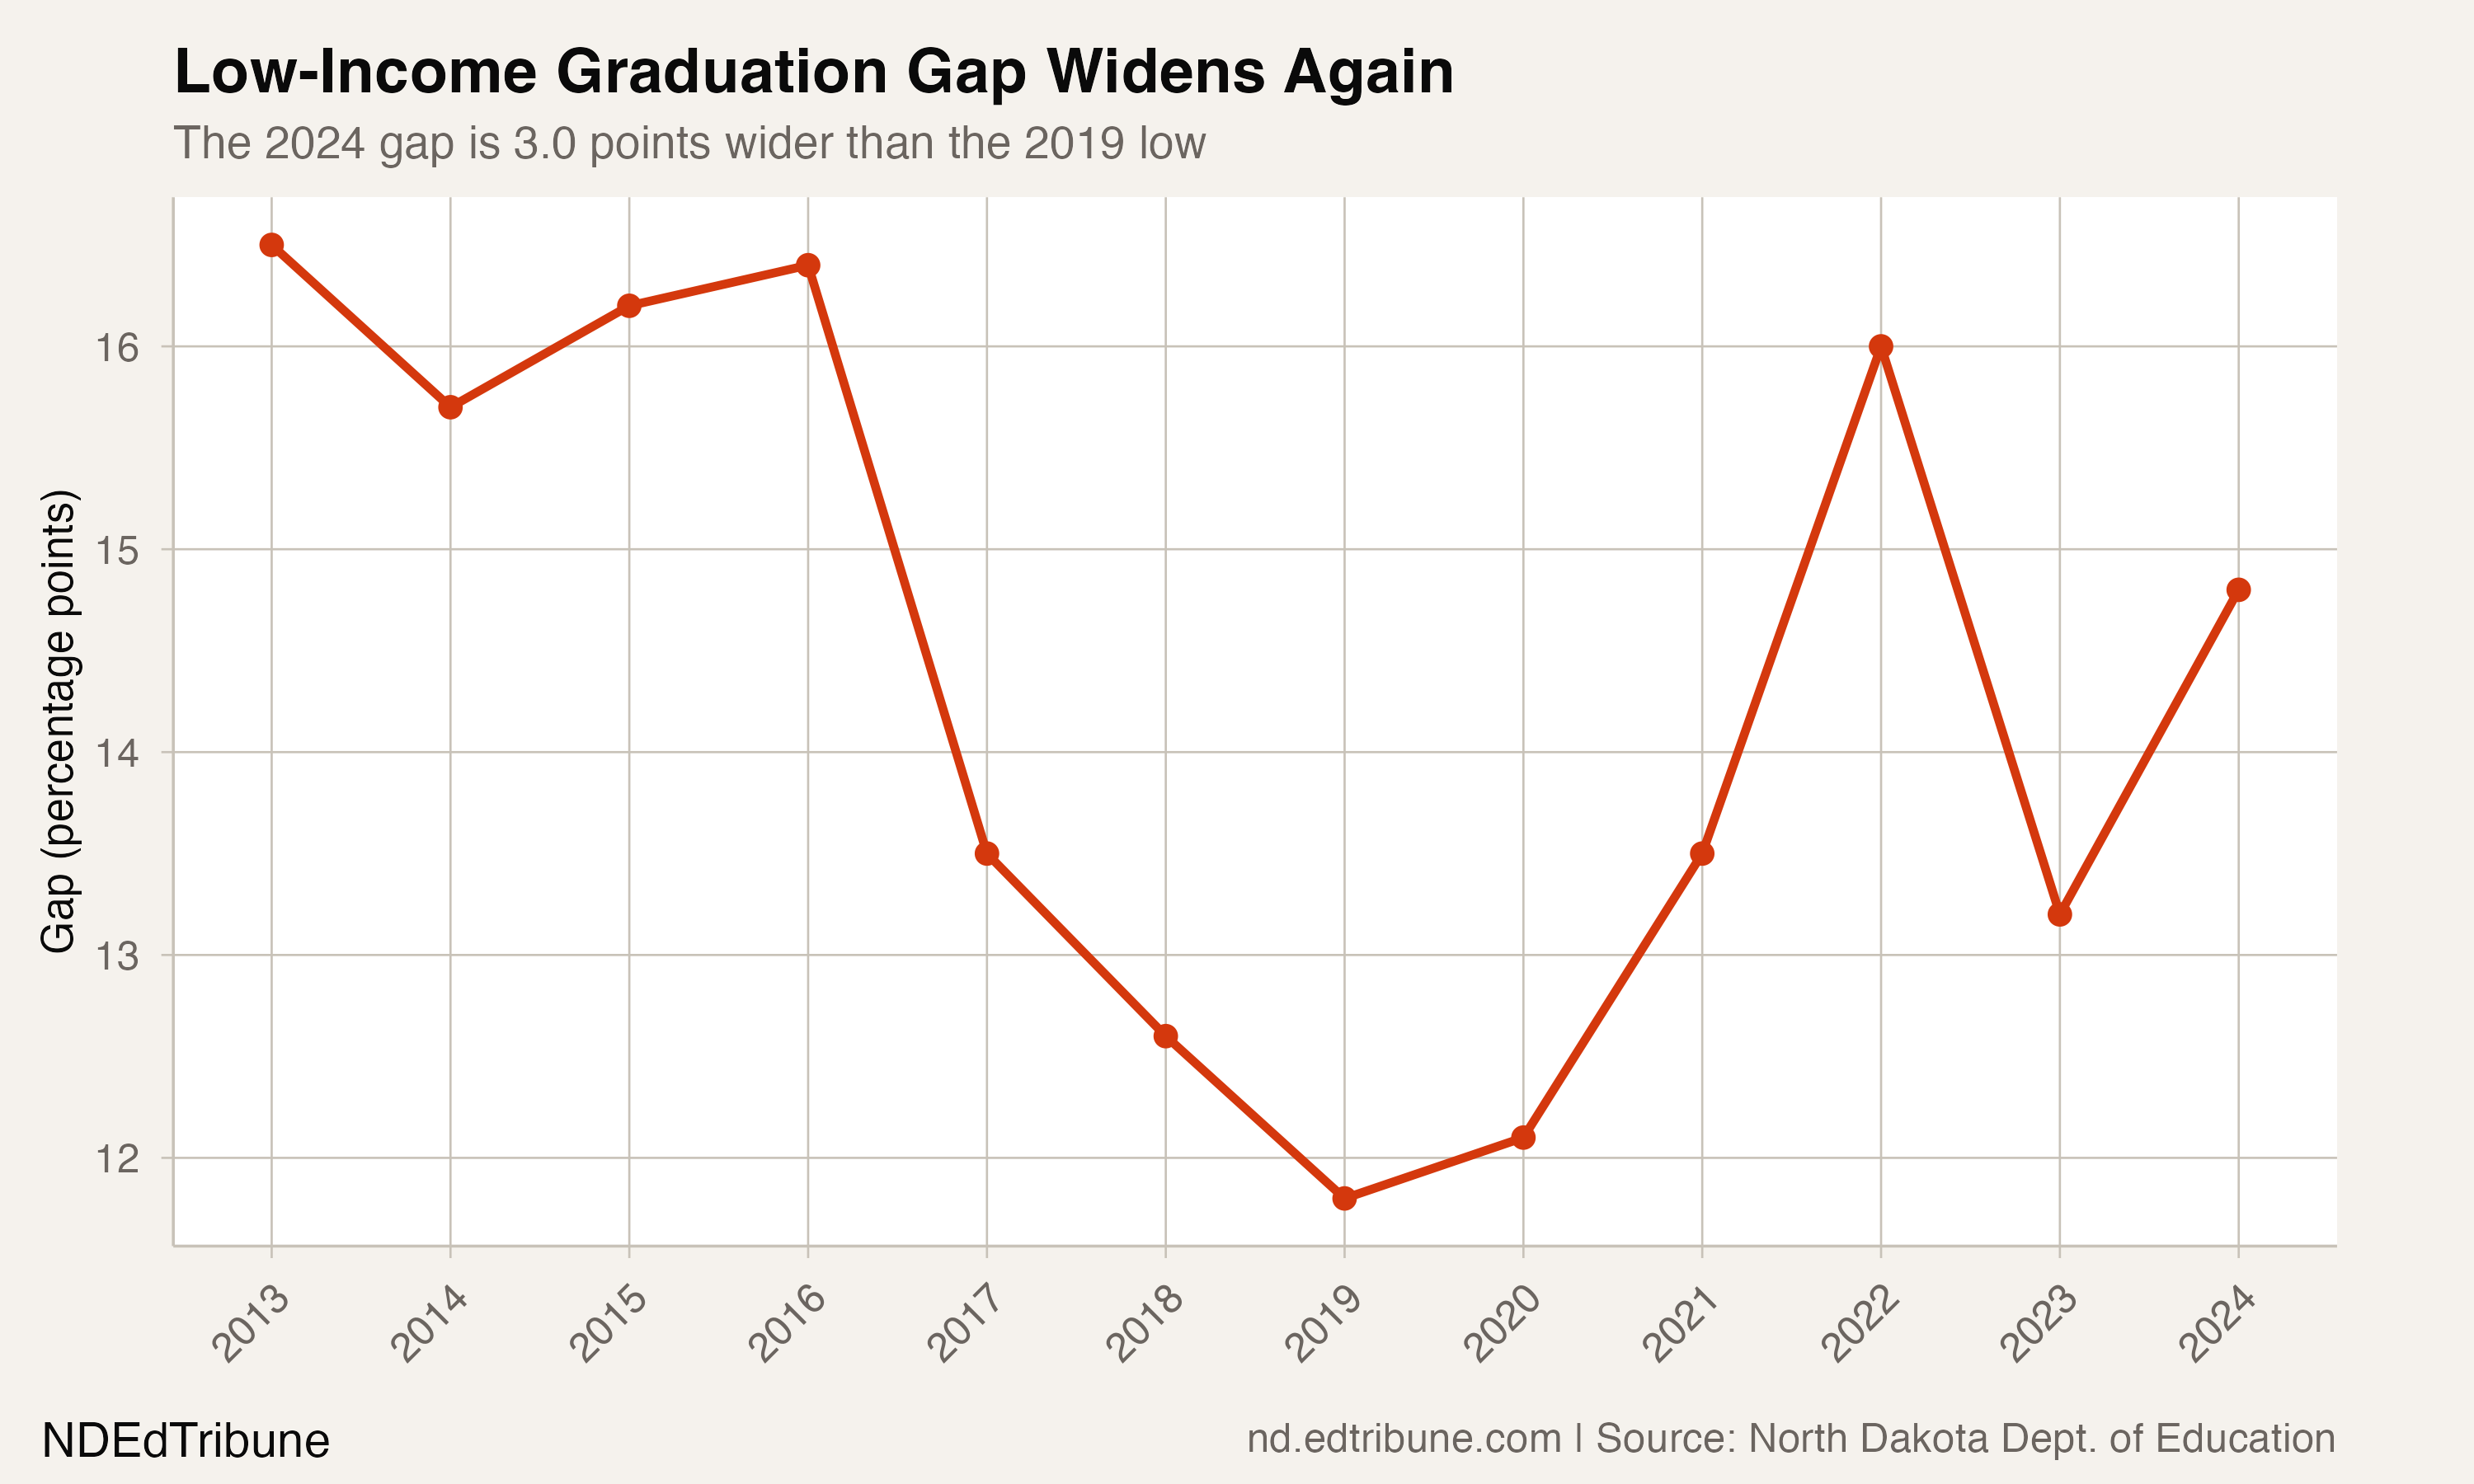
The economically disadvantaged graduation rate hit 67.6%, the lowest in 12 years of state data and 3.1 points below where the series began in 2013. The rate climbed from 70.7% in 2013 to 76.9% in 2020, then fell 9.3 points over the next four years. The gap to the state average widened to 14.8 points in 2024, still below the 16.5-point gap in 2013 but 3.0 points wider than the low point in 2019.
A seven-year climb, then a four-year reversal
The arc of the poverty gap tells the story of North Dakota's graduation challenge in miniature. From 2013 to 2019, the economically disadvantaged graduation rate rose from 70.7% to 76.5%. The gap to the overall rate narrowed from 16.5 to 11.8 percentage points.
Then 2021 brought a 3.4-point drop to 73.5%. In 2022, the rate fell to 68.3%. A modest recovery to 69.5% in 2023 proved temporary, with 2024 bringing a new low of 67.6%.
The low-income rate dropped 9.3 points from its 2020 peak, while the overall rate dropped 6.6 points. Low-income students fell faster and further.
A population-level crisis
This is not a small subgroup. With 2,302 students in the 2024 graduating cohort, economically disadvantaged students represented 26.5% of all North Dakota students in the four-year graduation cohort. One in four students in the graduation pipeline came from a low-income background, and roughly one in three of those students did not complete on time.
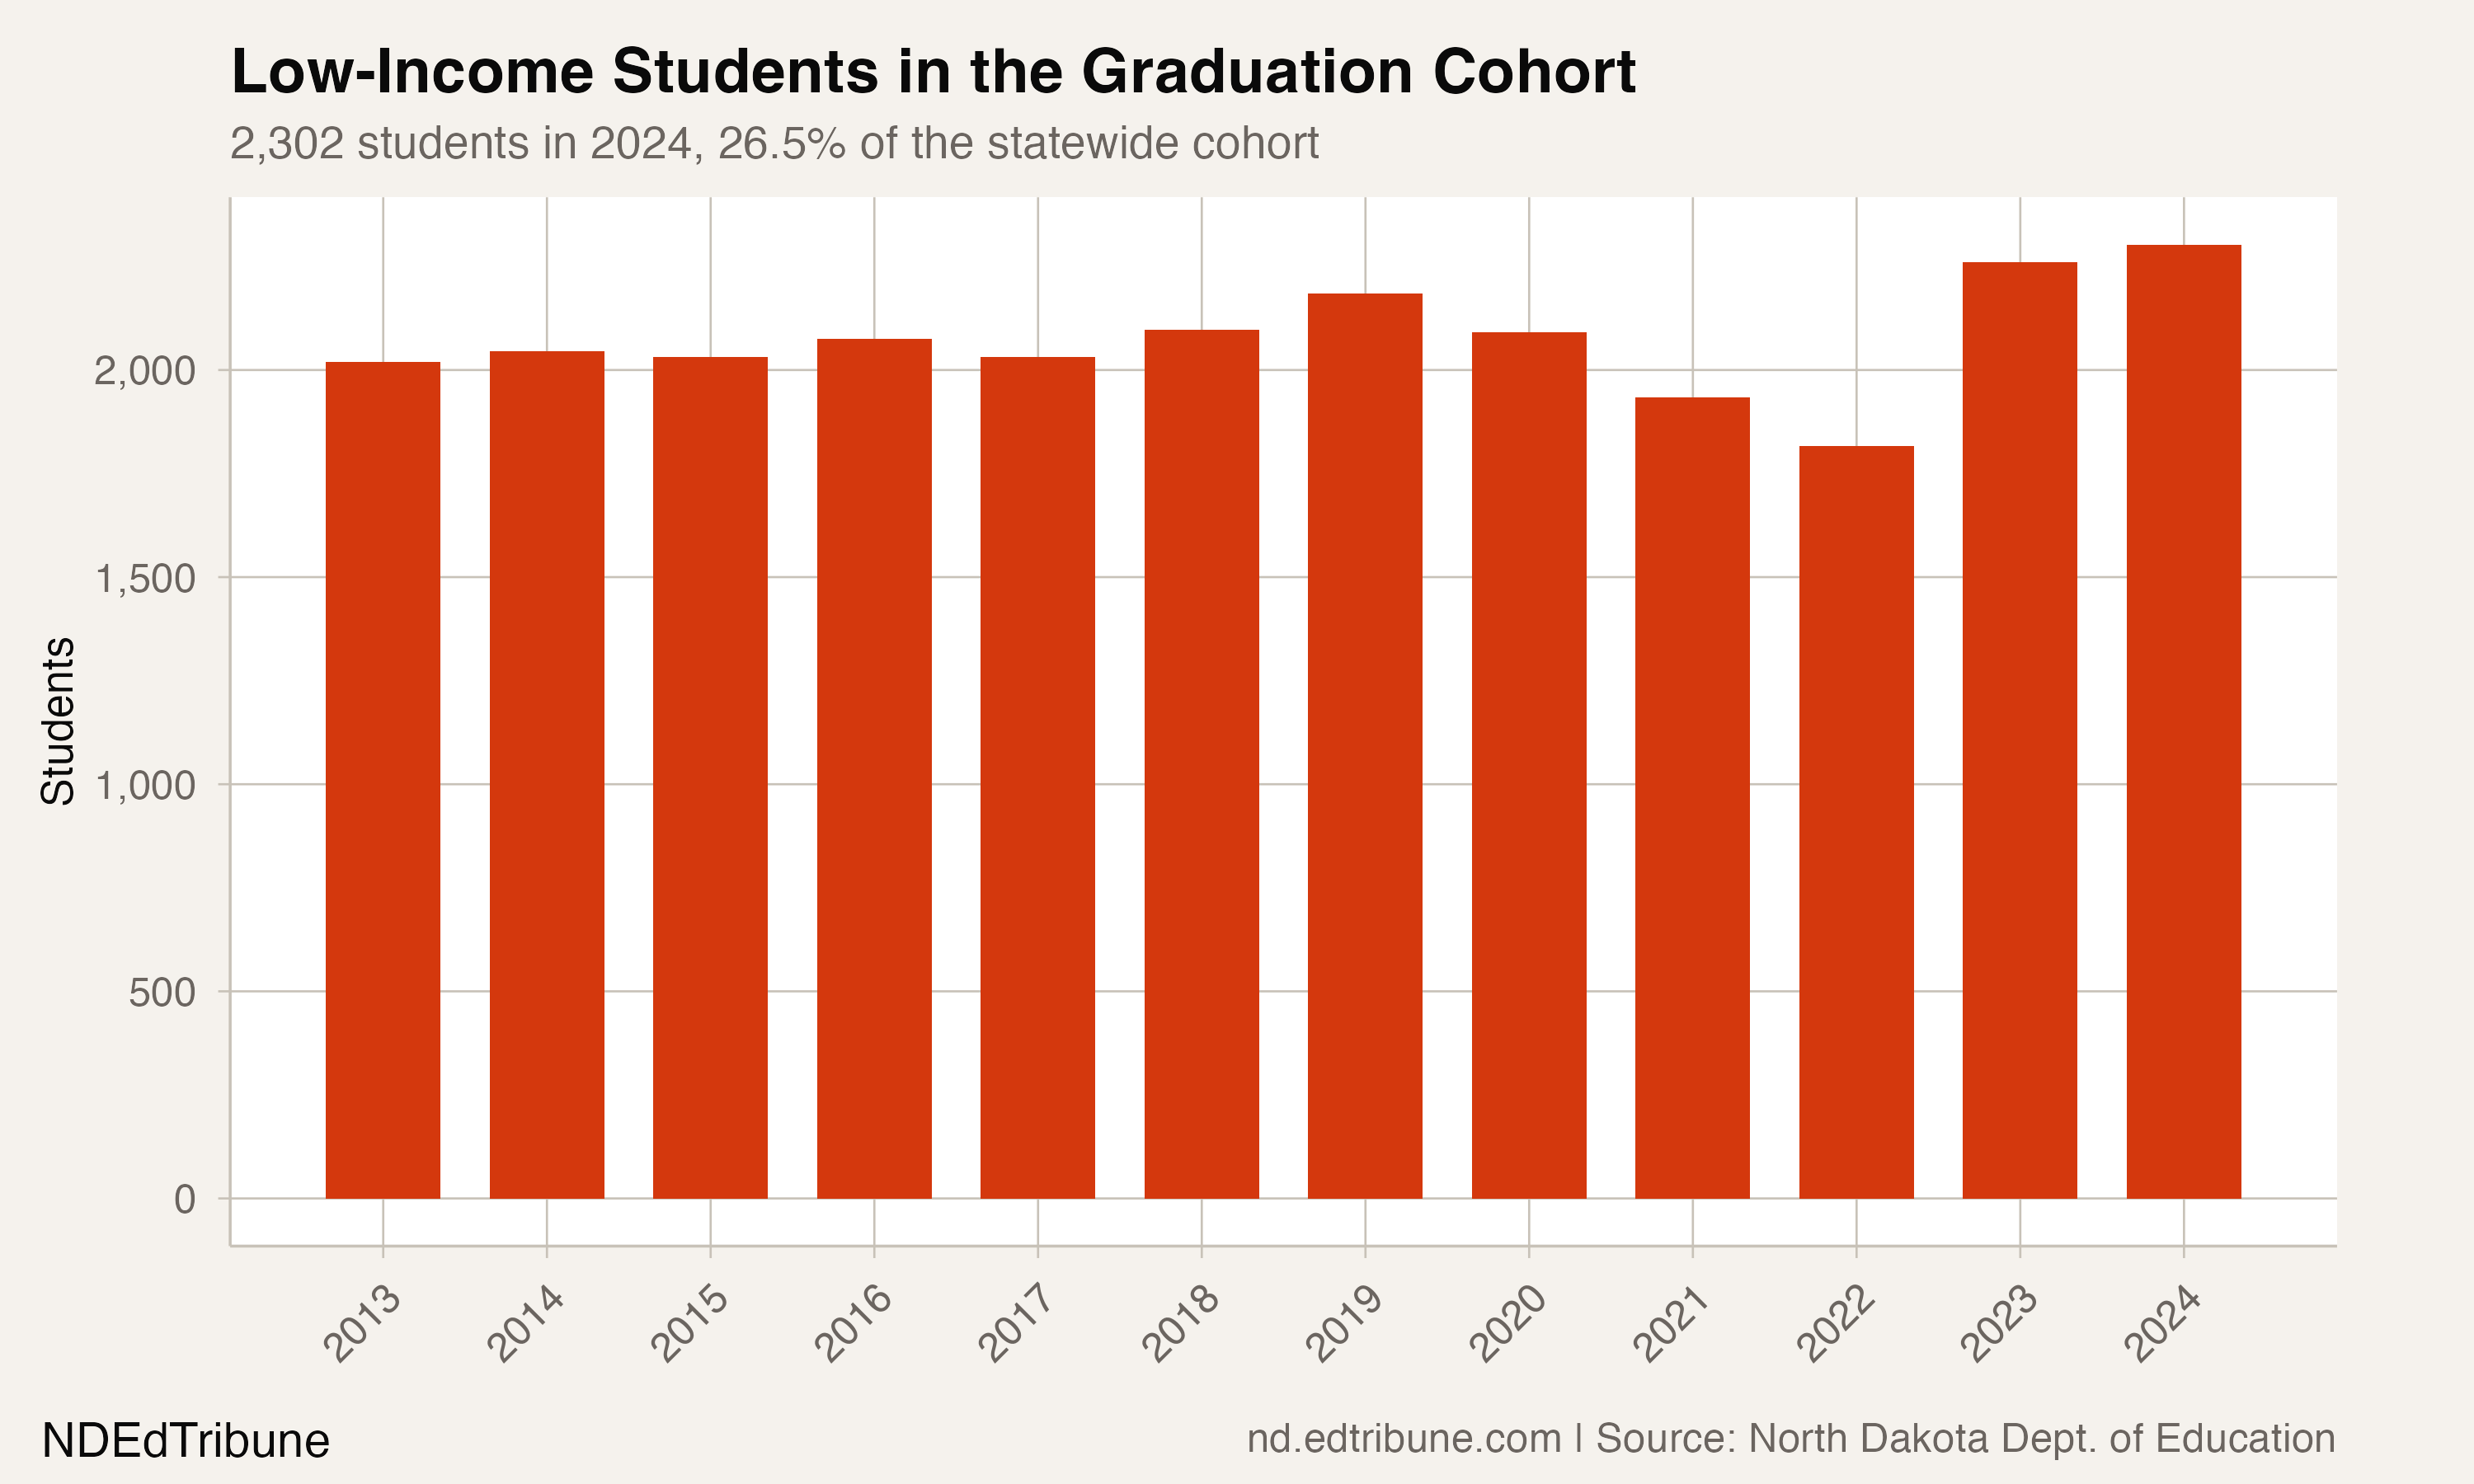
In absolute terms, 1,556 economically disadvantaged students graduated in 2024, while 746 did not. At the 2020 peak rate of 76.9%, about 1,770 would have graduated, a difference of 214 students.
Where the low-income rate sits among other gaps
The 67.6% rate for economically disadvantaged students sits close to the 63.4% rate for Native American students, the 69.0% rate for Hispanic students, and the 70.8% rate for Black students. These are not mutually exclusive categories: economically disadvantaged status can overlap with race and ethnicity, so the figures should be read as parallel warning lights rather than separate populations.
At the district level, the gap is visible in places like Minot↗ET, where economically disadvantaged students graduated at 53.4%, and Bismarck↗ET, where the rate was 55.7%.
The Title I question
North Dakota says Title I provides supplemental funding to help low-income schools improve the academic achievement of educationally disadvantaged students. That is suggestive context, not direct evidence about why the graduation gap widened: the graduation dataset verifies the size of the gap, but it does not show which interventions students received.
The state's school accountability guidance says North Dakota uses on-time graduation rates as one accountability element for public high schools.
That makes the 2,302-student low-income cohort a concrete accountability problem, not just a subgroup footnote.
Data from the North Dakota Department of Public Instruction.
Graduation rates represent four-year cohort rates. All years use the end-year convention (2024 = class of 2024).
Detailed code that reproduces the analysis and figures in this article is available exclusively to EdTribune subscribers.
Discussion
Sign in to join the discussion.
Loading comments...