Correction (July 26, 2026): An earlier version of this article said that neither Fargo nor West Fargo responded to a request for comment. We never sent either district a request for comment on this story, so the line misrepresented both. It was wrong about Fargo a second way: Superintendent Dr. Cory Steiner wrote to us on April 24, 2026, five days before this article published, answering questions we had put to him about Fargo's enrollment. We did not reflect that here. The line has been removed and his written remarks are now included below. We regret the error.
Correction (July 23, 2026): An earlier version said only Williston Basin and Minot posted graduation rates below the Fargo metro among large districts. Dickinson, at 78.0%, also sits below the metro and has been added.
Drive 10 minutes in any direction around Fargo↗ET and you will pass new subdivisions, school construction sites, and help-wanted signs. The metro area has been one of North Dakota's economic success stories for over a decade. West Fargo↗ET's graduating cohort has grown 67% since 2013, from 528 to 884 students. Families keep arriving.
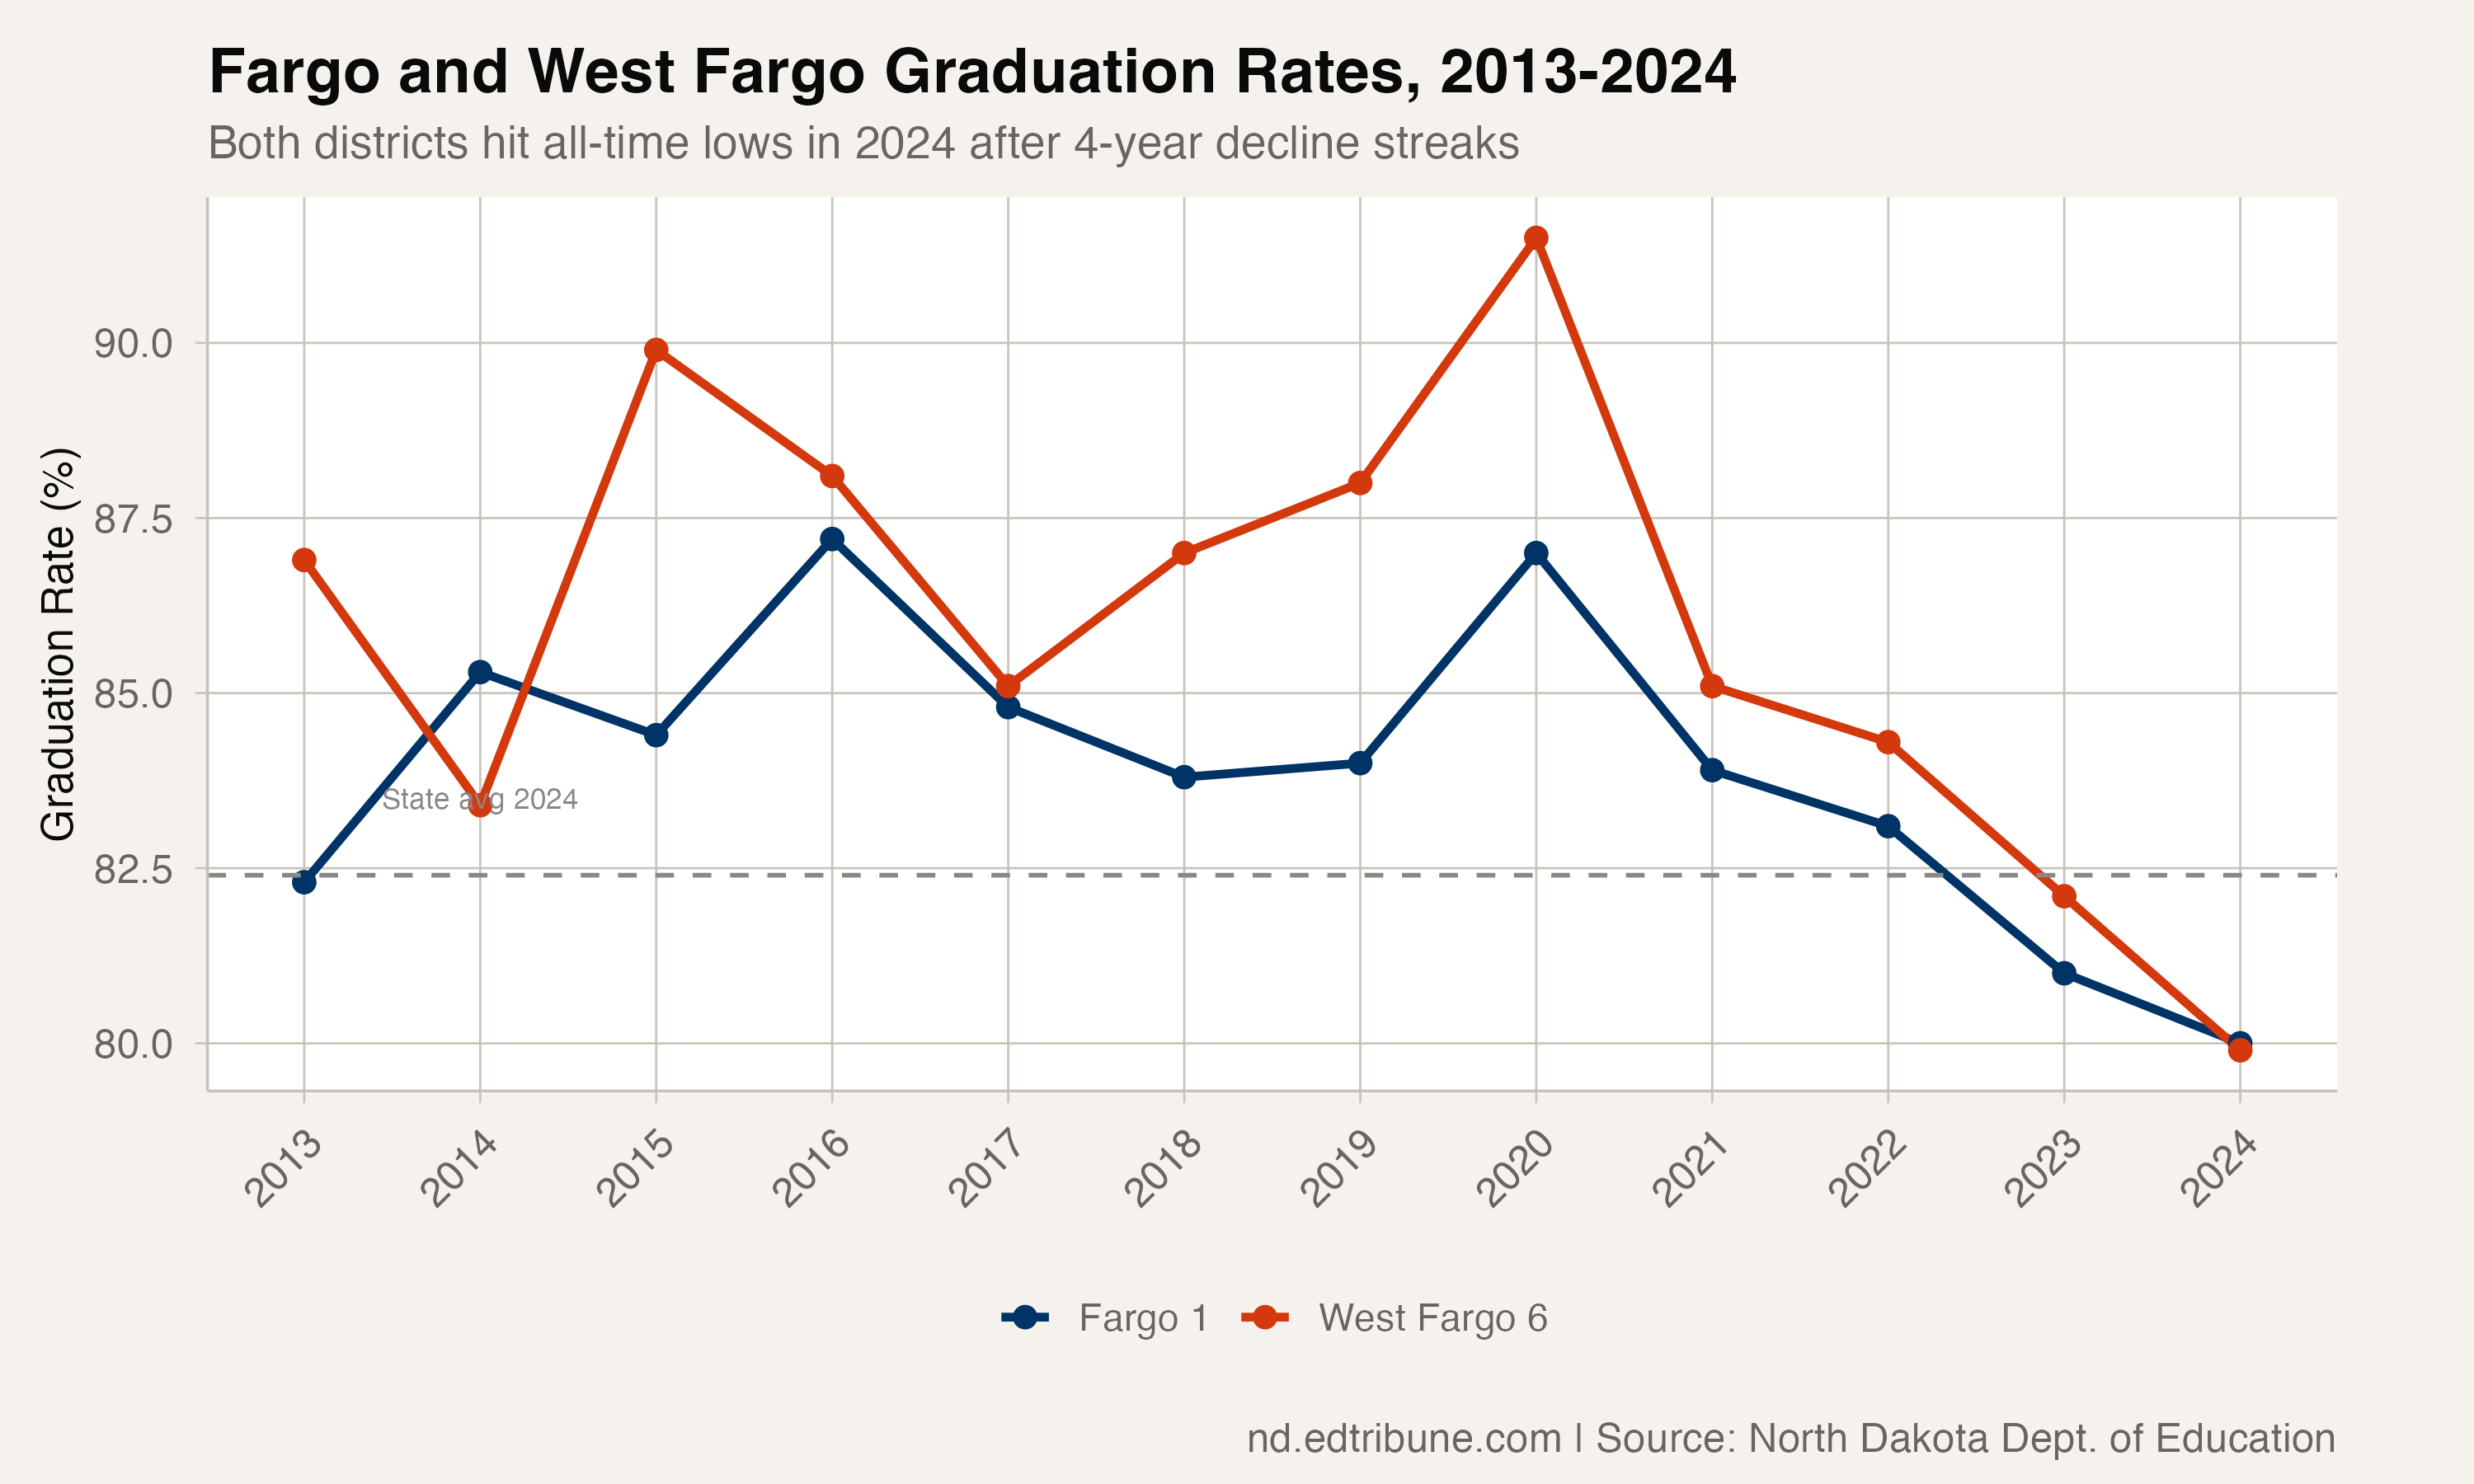
But more students has not meant more graduates. Fargo posted an 80% graduation rate in 2024, its worst on record. West Fargo, just across the river, hit 79.9%. Both districts are in four-year decline streaks, and together they serve 1,833 graduating seniors -- more than a fifth of the state's entire cohort.
West Fargo's reversal
The West Fargo story is the more dramatic of the two. In 2020, the district posted 91.5%, the highest graduation rate among any large district in North Dakota. Four years later, it sits at 79.9%, an 11.6-point drop that took the district from best-in-class to below the state average.
The decline has been relentless: 85.1% in 2021, 84.3% in 2022, 82.1% in 2023, 79.9% in 2024. No year brought a reprieve. For a district that spent most of the past decade above 85%, falling below 80% represents unfamiliar territory.
West Fargo's cohort growth is the key context. The district has absorbed hundreds of additional students, many from refugee and immigrant families. A graduating class of 884 students is a fundamentally different challenge than the 528-student cohort of 2013, and the demographic complexity of the new arrivals requires resources that the district's completion systems have not kept pace with.
Fargo's slow erosion
Fargo's decline has been less steep but just as persistent. The district fluctuated between 82% and 87% for most of the past decade, reaching 87.2% in 2016. Since 2021, it has dropped each year: 83.9%, 83.1%, 81%, 80%.
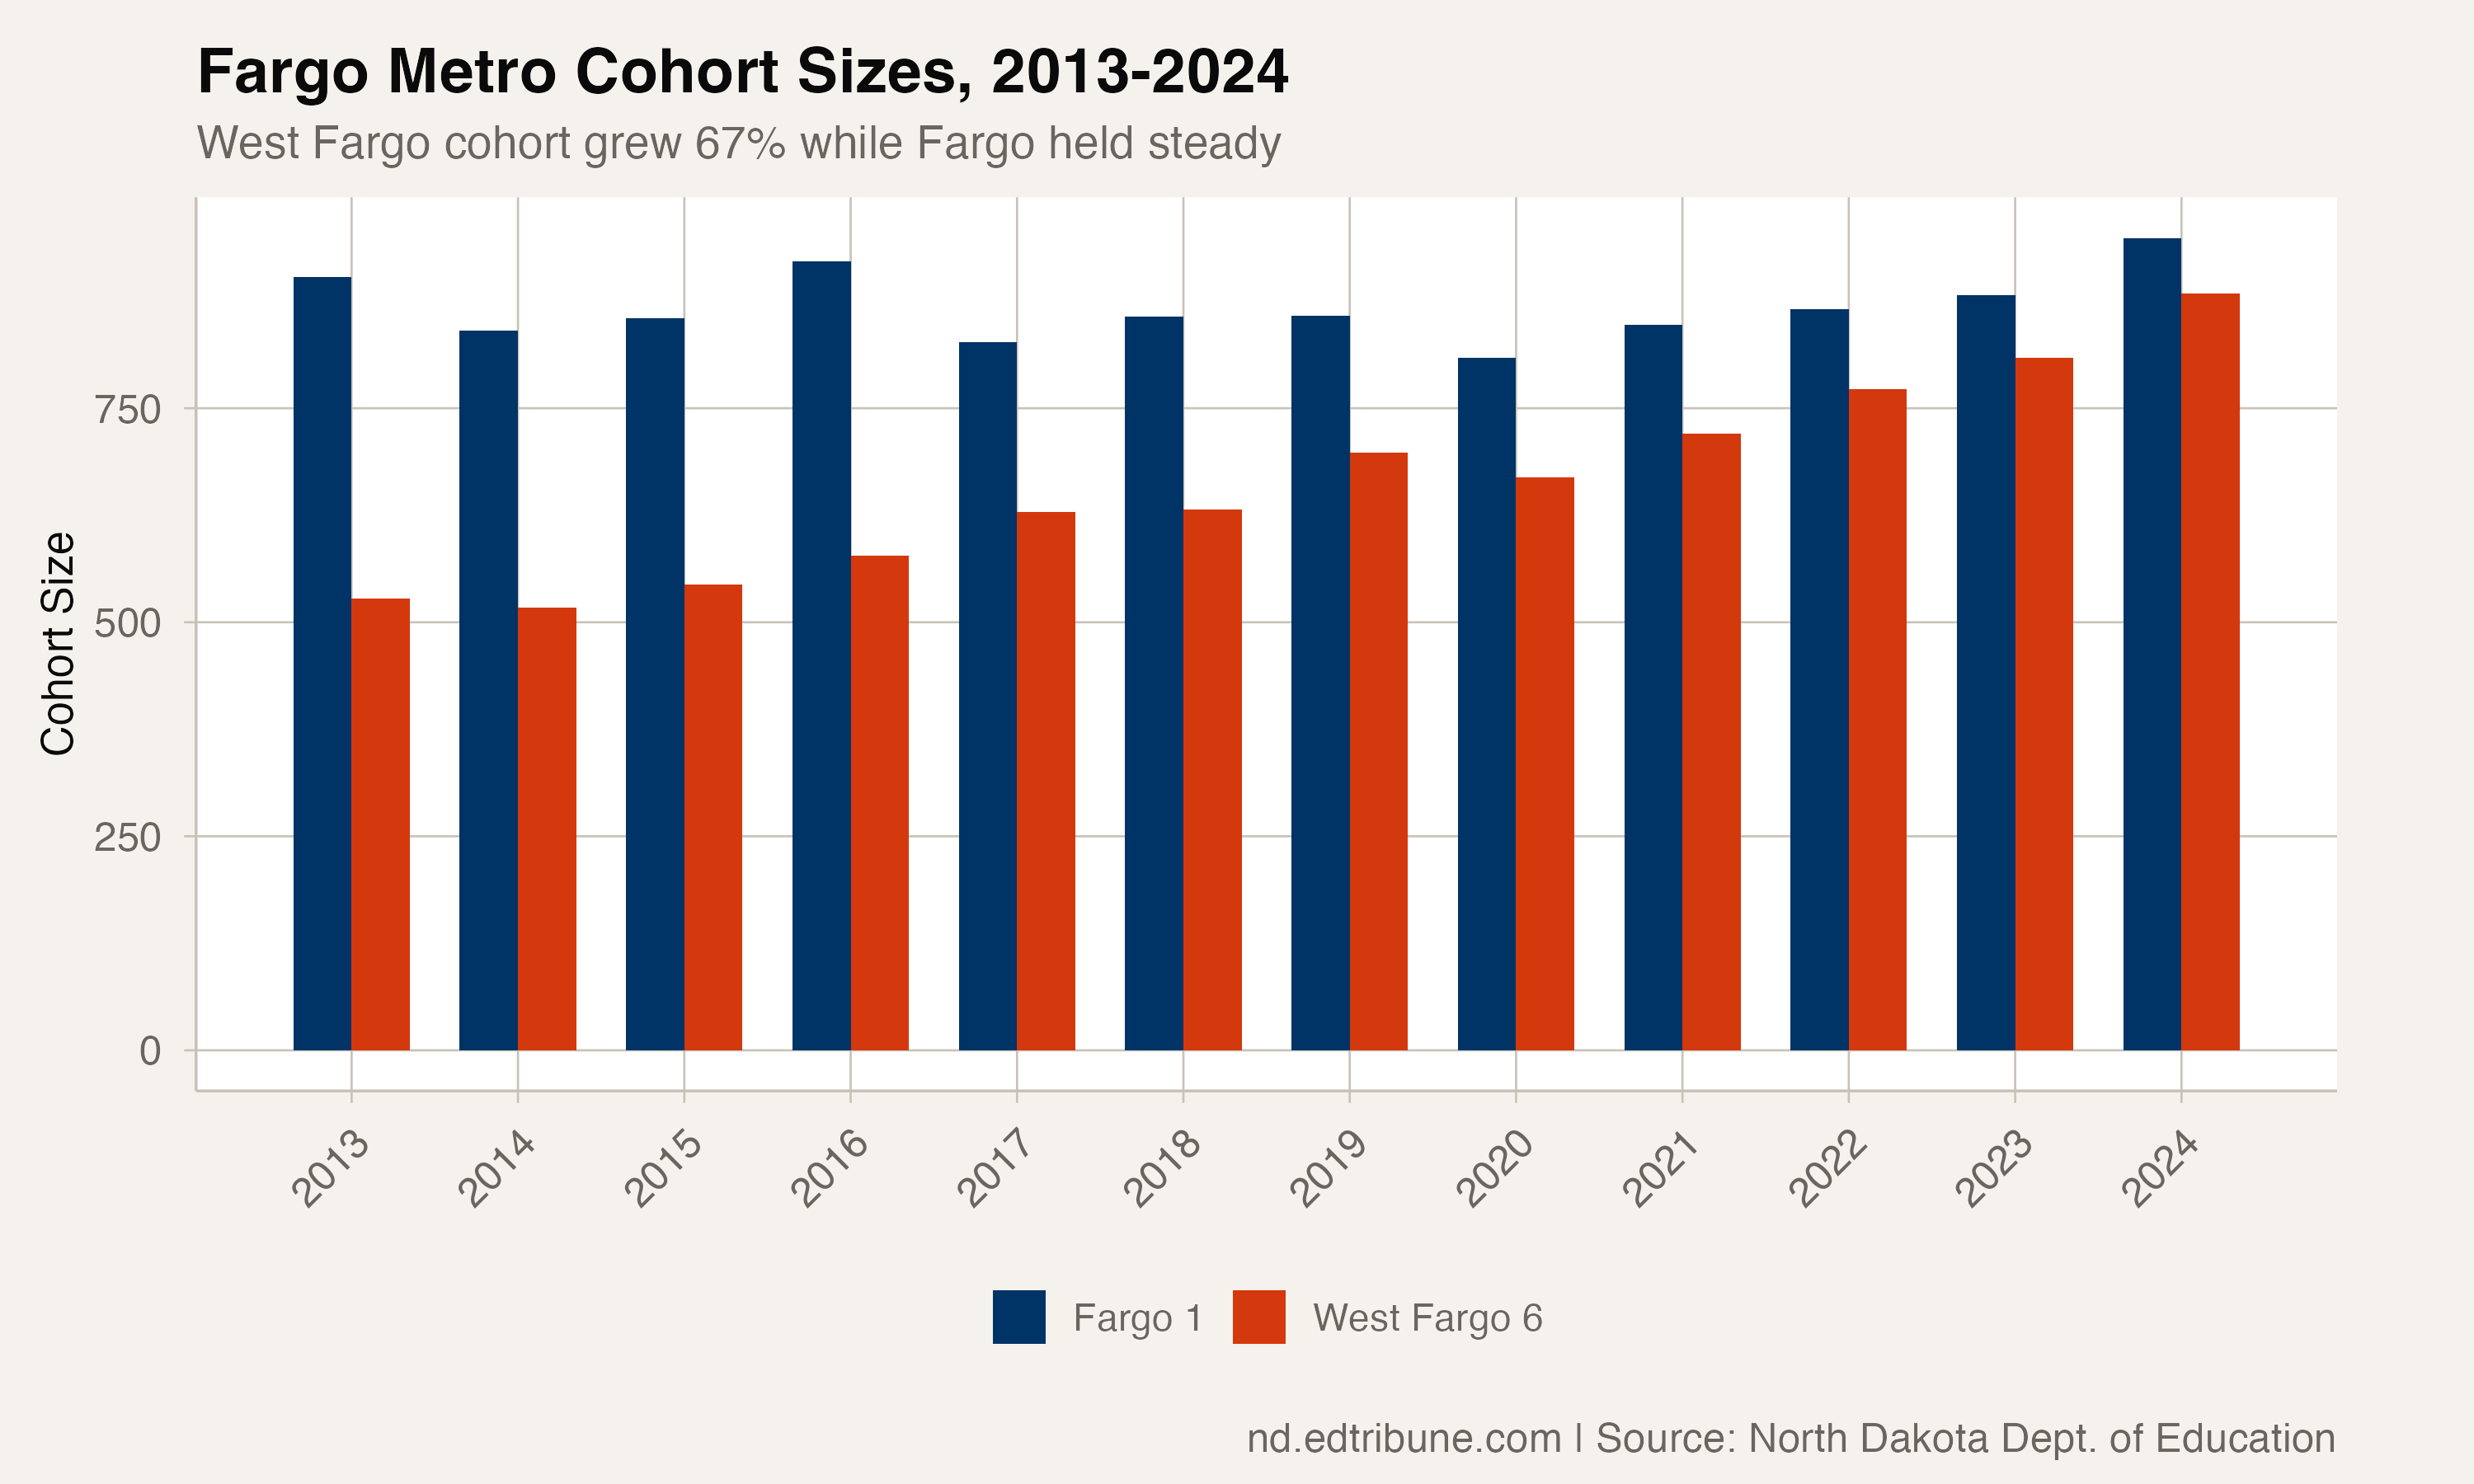
Fargo's cohort has been more stable than West Fargo's, growing from 903 to 949 students. The decline here is less about rapid demographic change and more about a broader loss of graduation momentum that mirrors the statewide trend. At 80%, Fargo sits 2.4 points below the state average of 82.4%, after spending most of the prior decade above it.
Among the large districts
With 949 and 884 students respectively, Fargo and West Fargo dwarf most other North Dakota districts. Among the nine districts with cohorts above 200, only Williston Basin↗ET (68.6%), Minot↗ET (69.9%), and Dickinson (78.0%) post lower rates. Bismarck↗ET (84.5%), Mandan↗ET (85.3%), and Grand Forks↗ET (82.8%) all outperform the Fargo metro despite serving similarly sized populations.
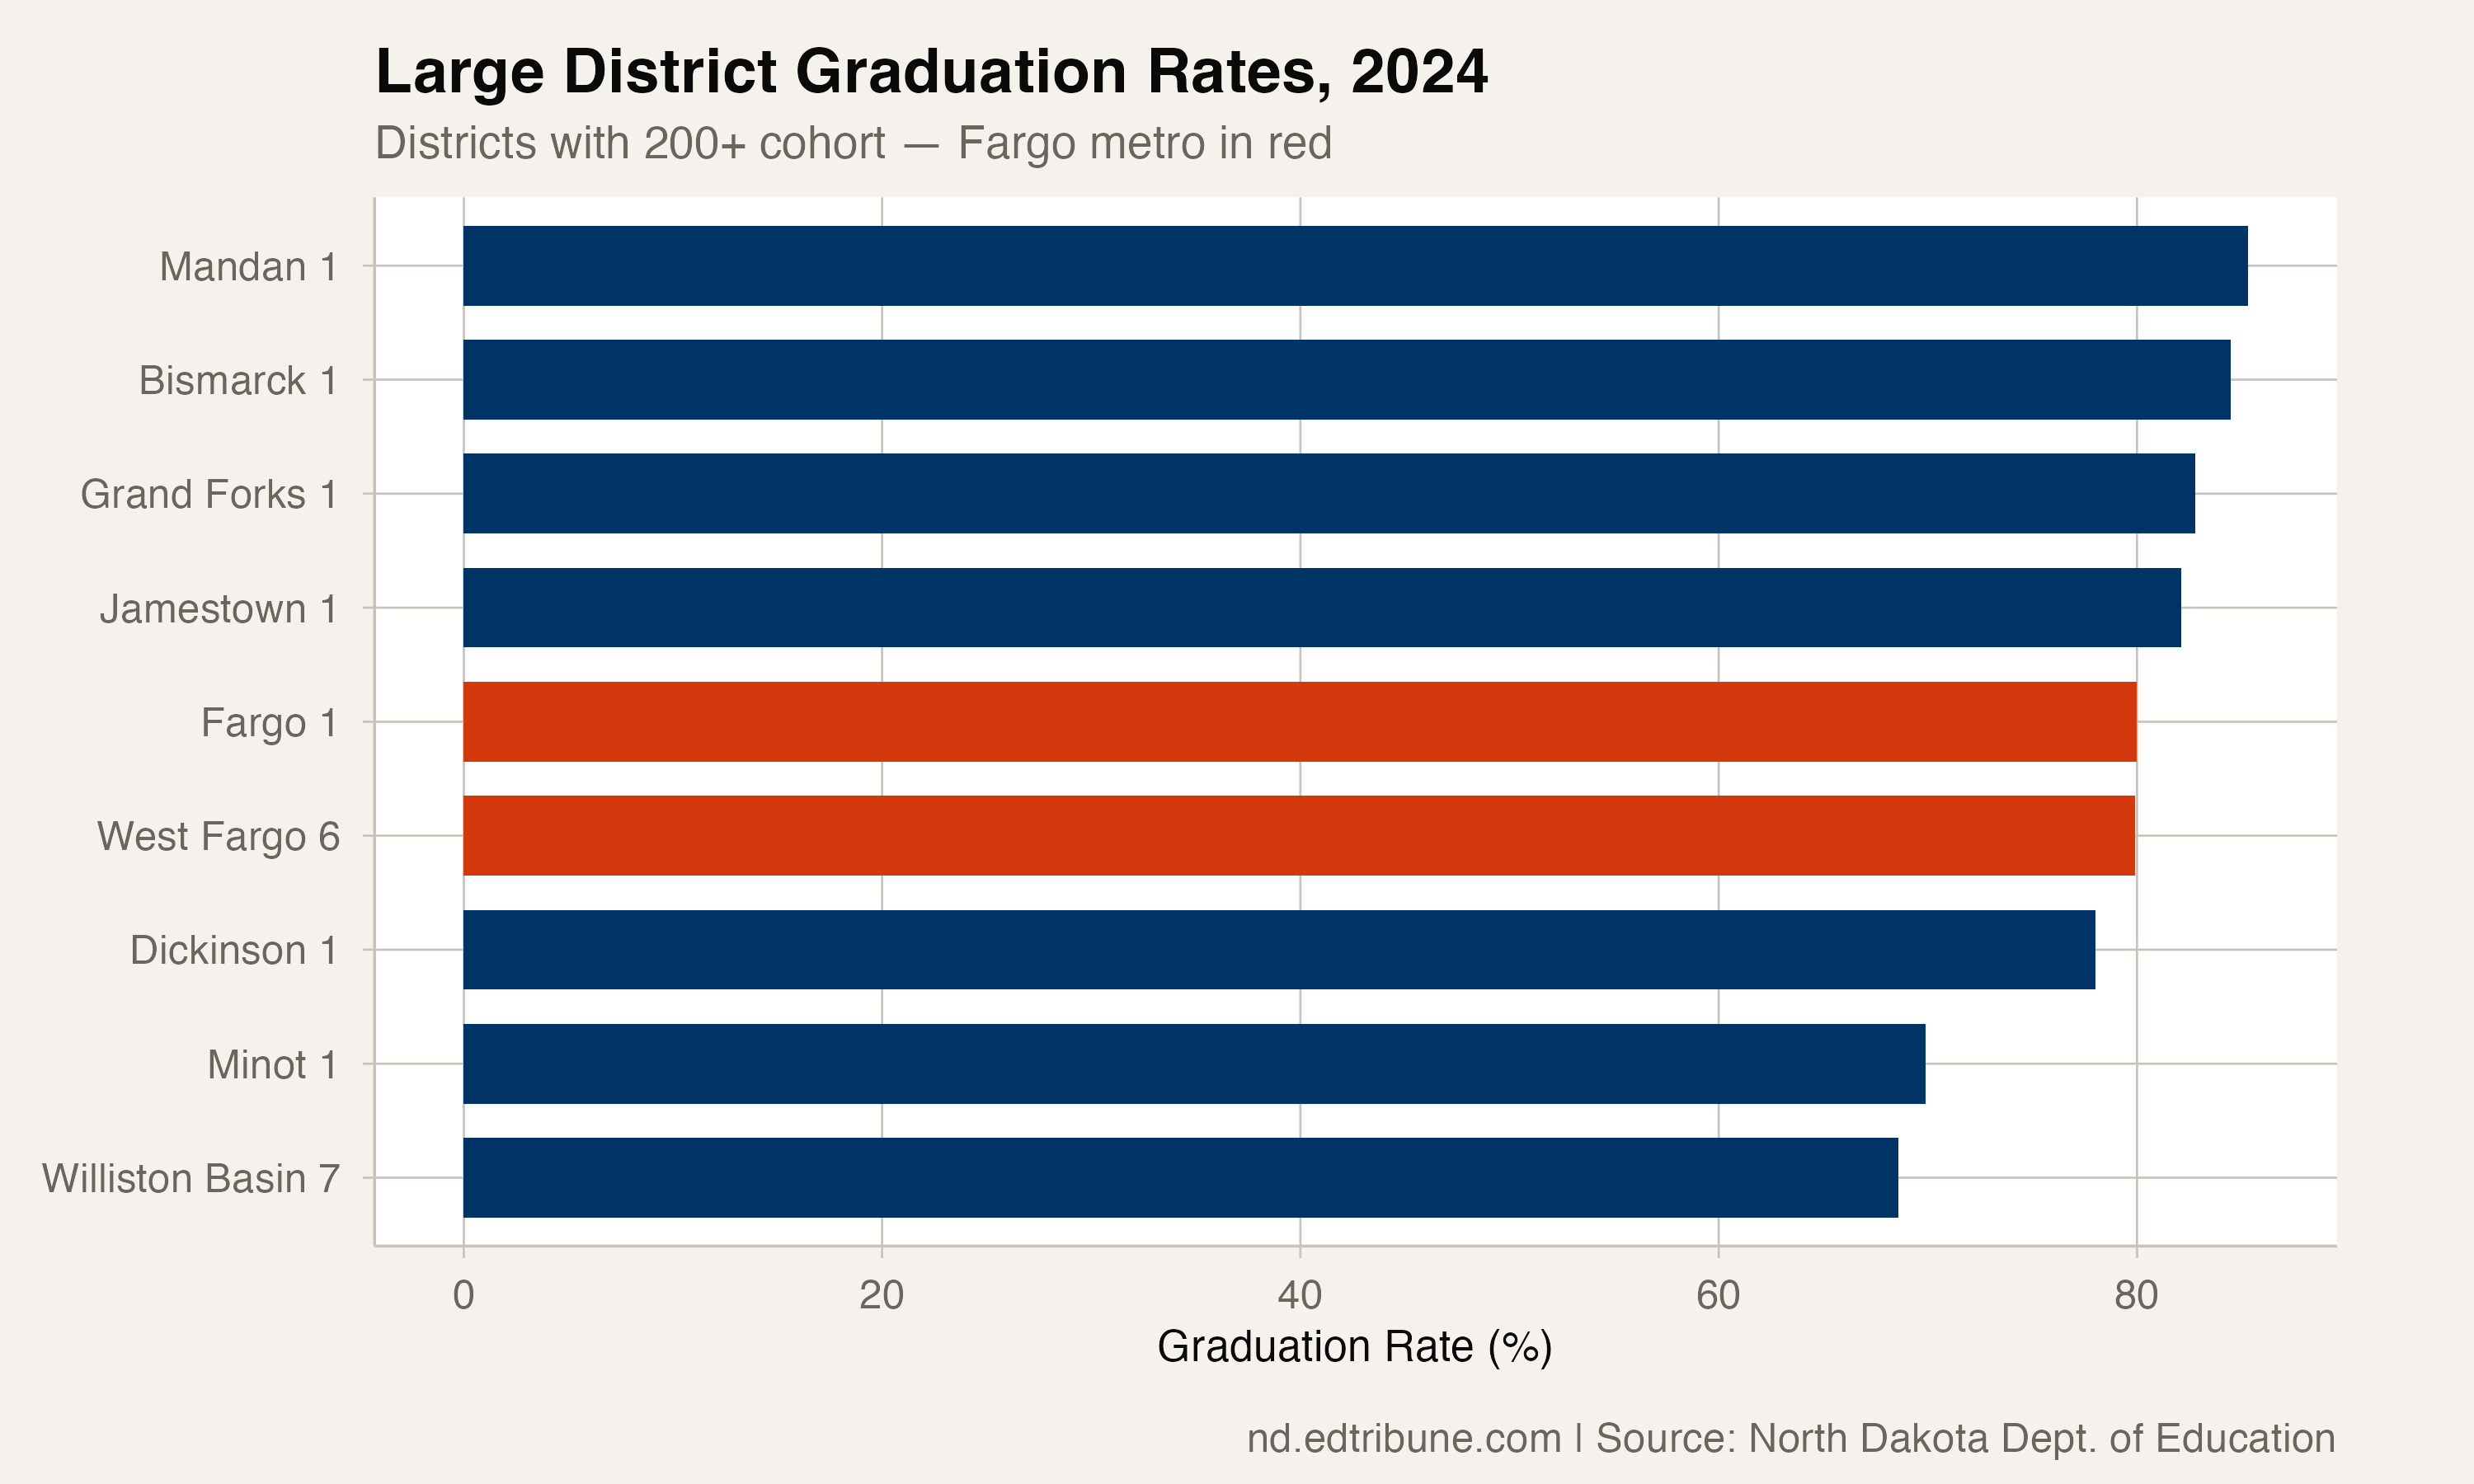
The contrast with Bismarck is instructive. The state capital serves the largest cohort in the state at 1,057 students and graduated 84.5% on time. That rate is declining too, but Bismarck has fallen less far, less fast, and from a higher starting point. Grand Forks, the third-largest district, actually rebounded in 2024, climbing 5.5 points to 82.8% after hitting its own all-time low the prior year.
Growth and graduation in tension
West Fargo's 67% cohort growth since 2013 is the sharper version of a problem both districts face. Adding 356 students to a graduation pipeline means more English language learners, more students with interrupted schooling, more families navigating an unfamiliar education system. The 2020 peak of 91.5% may have been the last year the old systems could handle the volume.
Fargo's situation is harder to explain. Cohort growth has been modest -- just 5% over 12 years. The decline there points to something beyond demographics. Whether it is the same post-pandemic forces depressing graduation rates statewide or something specific to how Fargo runs its high schools, the data alone cannot say.
Fargo Superintendent Dr. Cory Steiner, writing to The NDEdTribune in April in answer to questions about the district's enrollment, described Fargo's numbers as cohort arithmetic rather than a recent break. Enrollment has been "overall stable for the last five years," he said. "Most grade level changes are due to grade level cohorts moving through the system. At this time, our graduating senior classes remain larger than incoming kindergarten classes." He did not address the district's graduation rate.
Steiner traced the size gap between the two districts to lines drawn decades before either superintendent arrived. North Dakota's legislature established the district boundaries in the 1960s, and the West Fargo district takes in part of the City of Fargo along with Harwood and Horace. "Fargo Public Schools' district boundary is limited in its areas for housing growth," he wrote. "In comparison, the City of West Fargo and the other towns that WFPS serves are growing."
What the graduation data says is that the state's largest metro graduated fewer than 80% of its students on time at both of its major districts, while still building homes and schools as fast as the concrete will cure.
Data from the North Dakota Department of Public Instruction. Graduation rates represent four-year cohort rates. All years use the end-year convention (2024 = class of 2024).
Detailed code that reproduces the analysis and figures in this article is available exclusively to EdTribune subscribers.
Discussion
Sign in to join the discussion.
Loading comments...