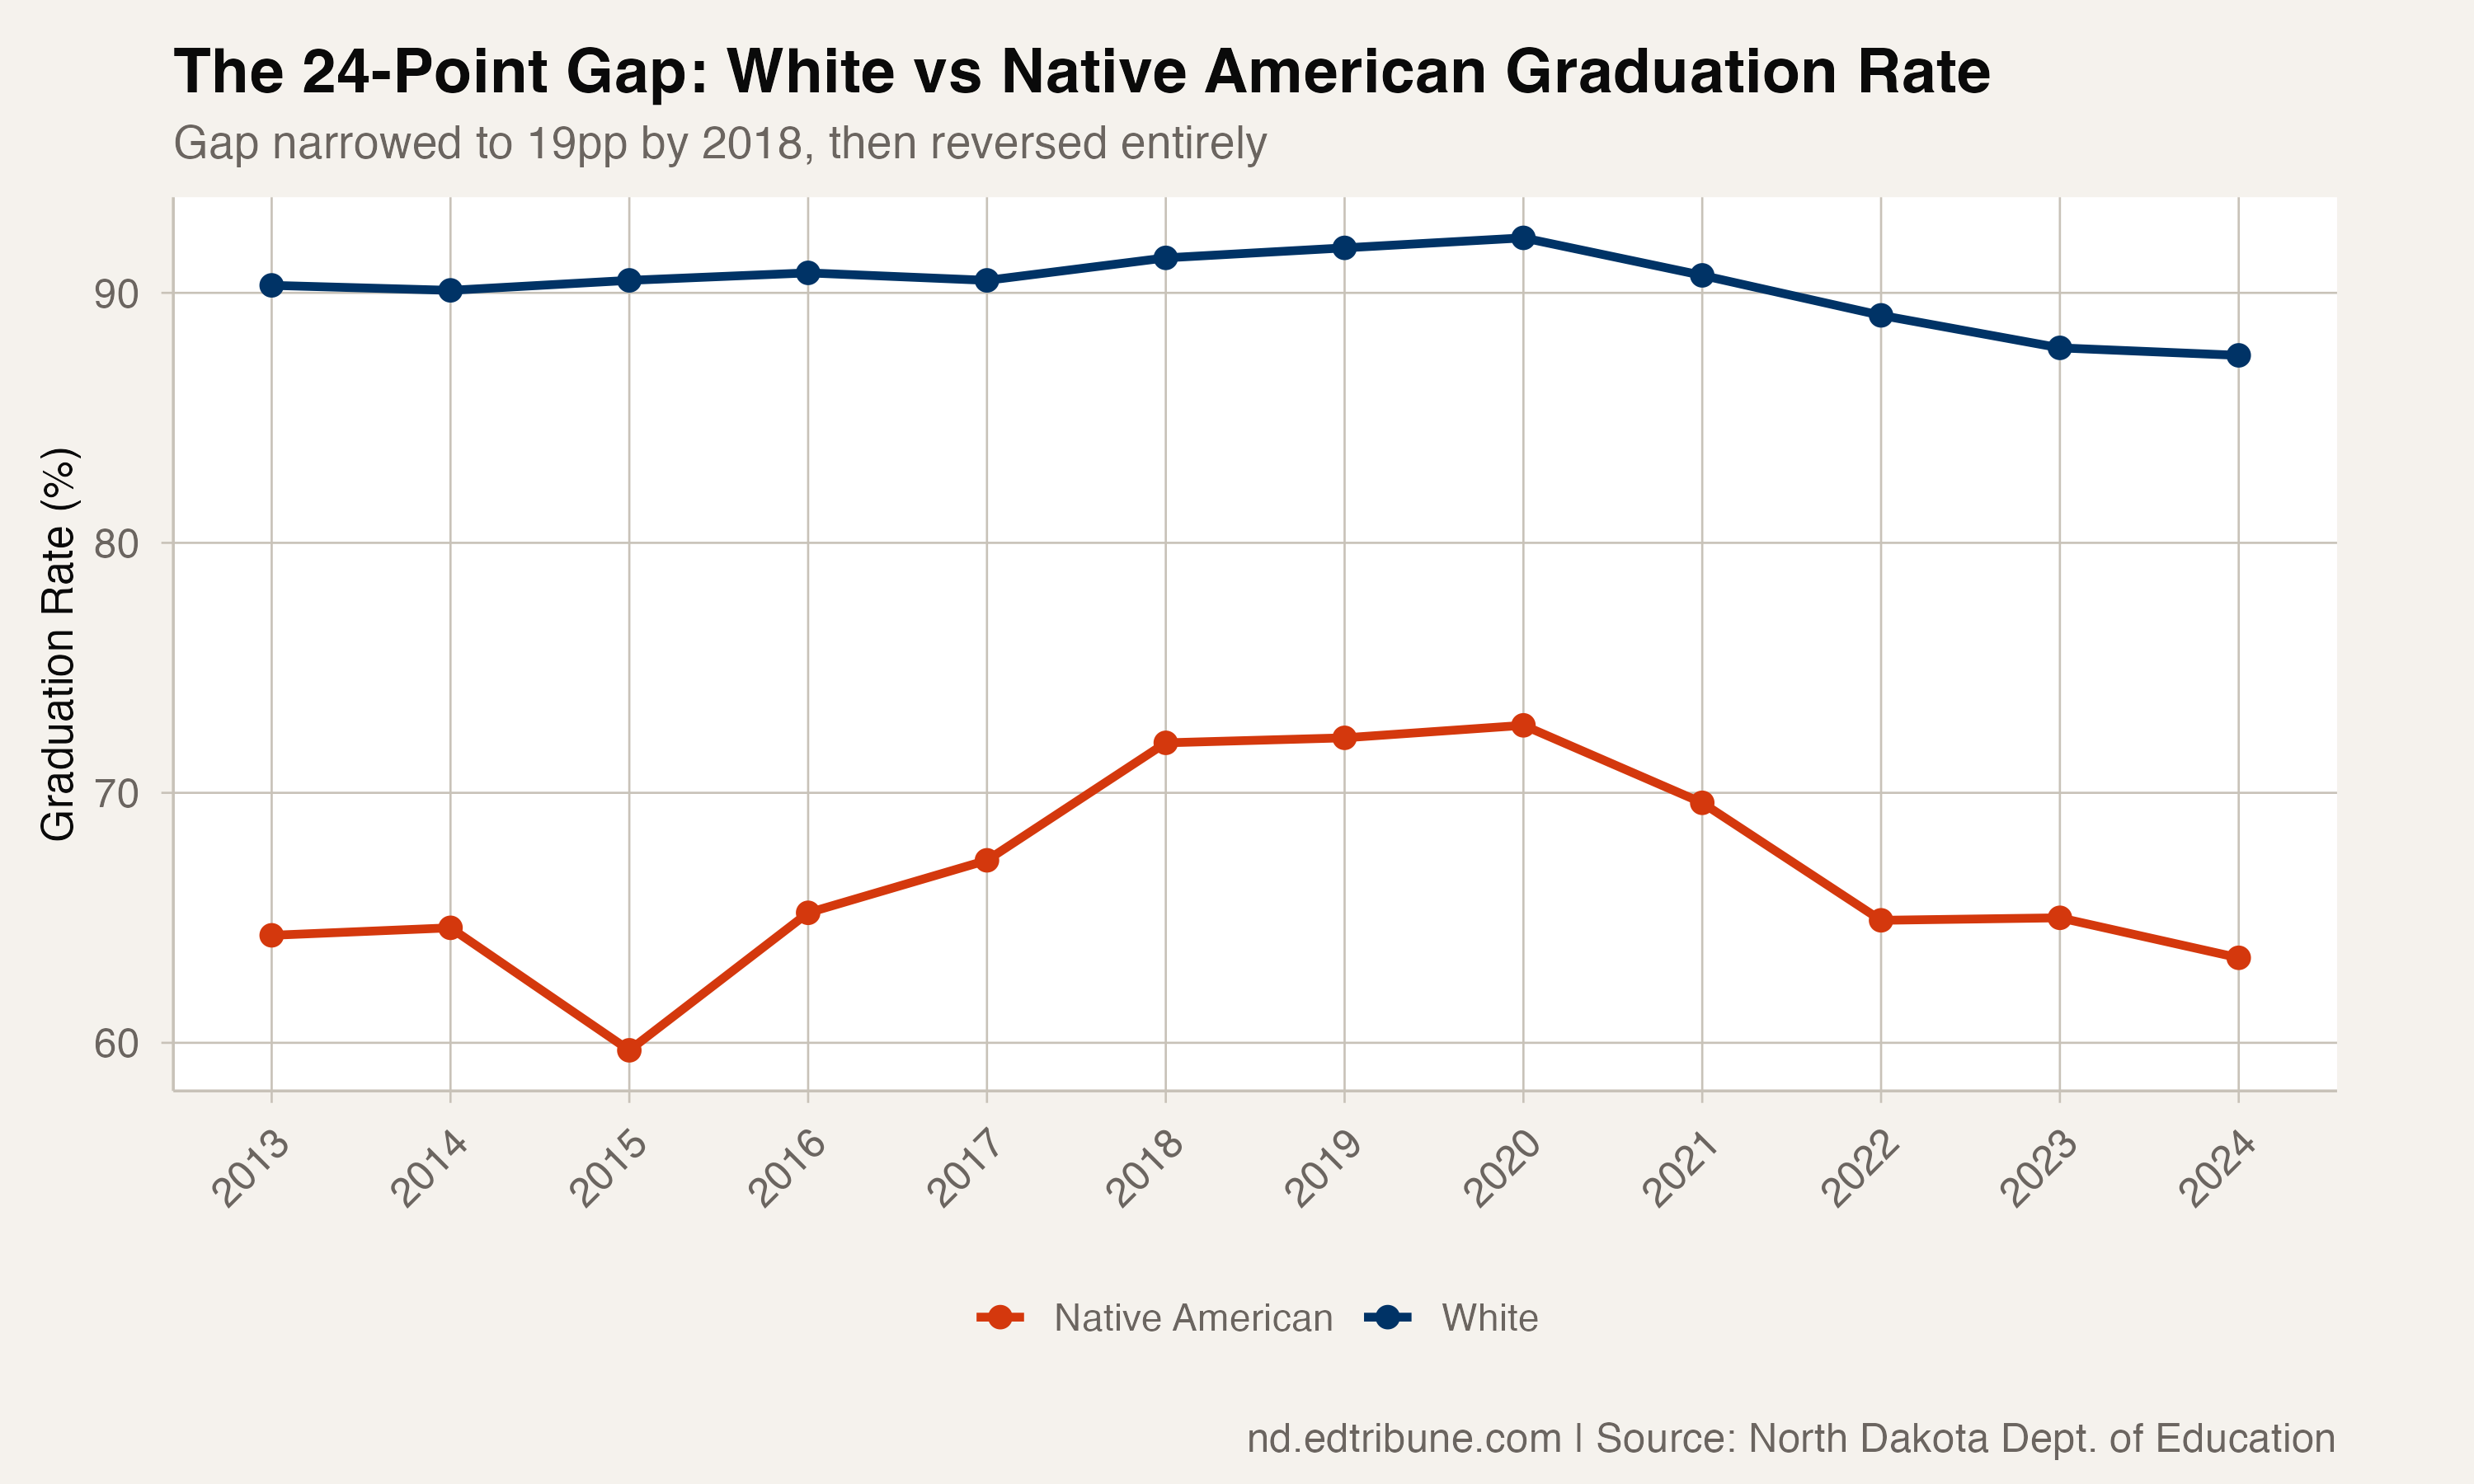
Between 2013 and 2018, something worked. The graduation rate for Native American students in North Dakota climbed from 64.3% to 72%, and the gap with white students narrowed from 26 percentage points to 19.4.
Then it unraveled. By 2024, the gap had widened back to 24.1 points, with Native American students graduating at 63.4% compared to 87.5% for white students. The Native American rate has returned to within a point of where it stood 11 years earlier, while the cohort has grown 45.8%, from 644 to 939 students.
The arc of the gap
The story unfolds in three phases. From 2013 to 2015, the gap was wide and the Native American rate hit its all-time low of 59.7%. Then came a five-year stretch of sustained improvement: the rate climbed steadily to 72.7% by 2020, closing the gap to roughly 20 points. Researchers, educators, and tribal leaders could point to real progress.
Then 2021 hit. The Native American rate dropped to 69.6% while the white rate fell more modestly to 90.7%. Each subsequent year brought further divergence. By 2024, Native American students were graduating at rates essentially unchanged from when North Dakota began tracking this data.
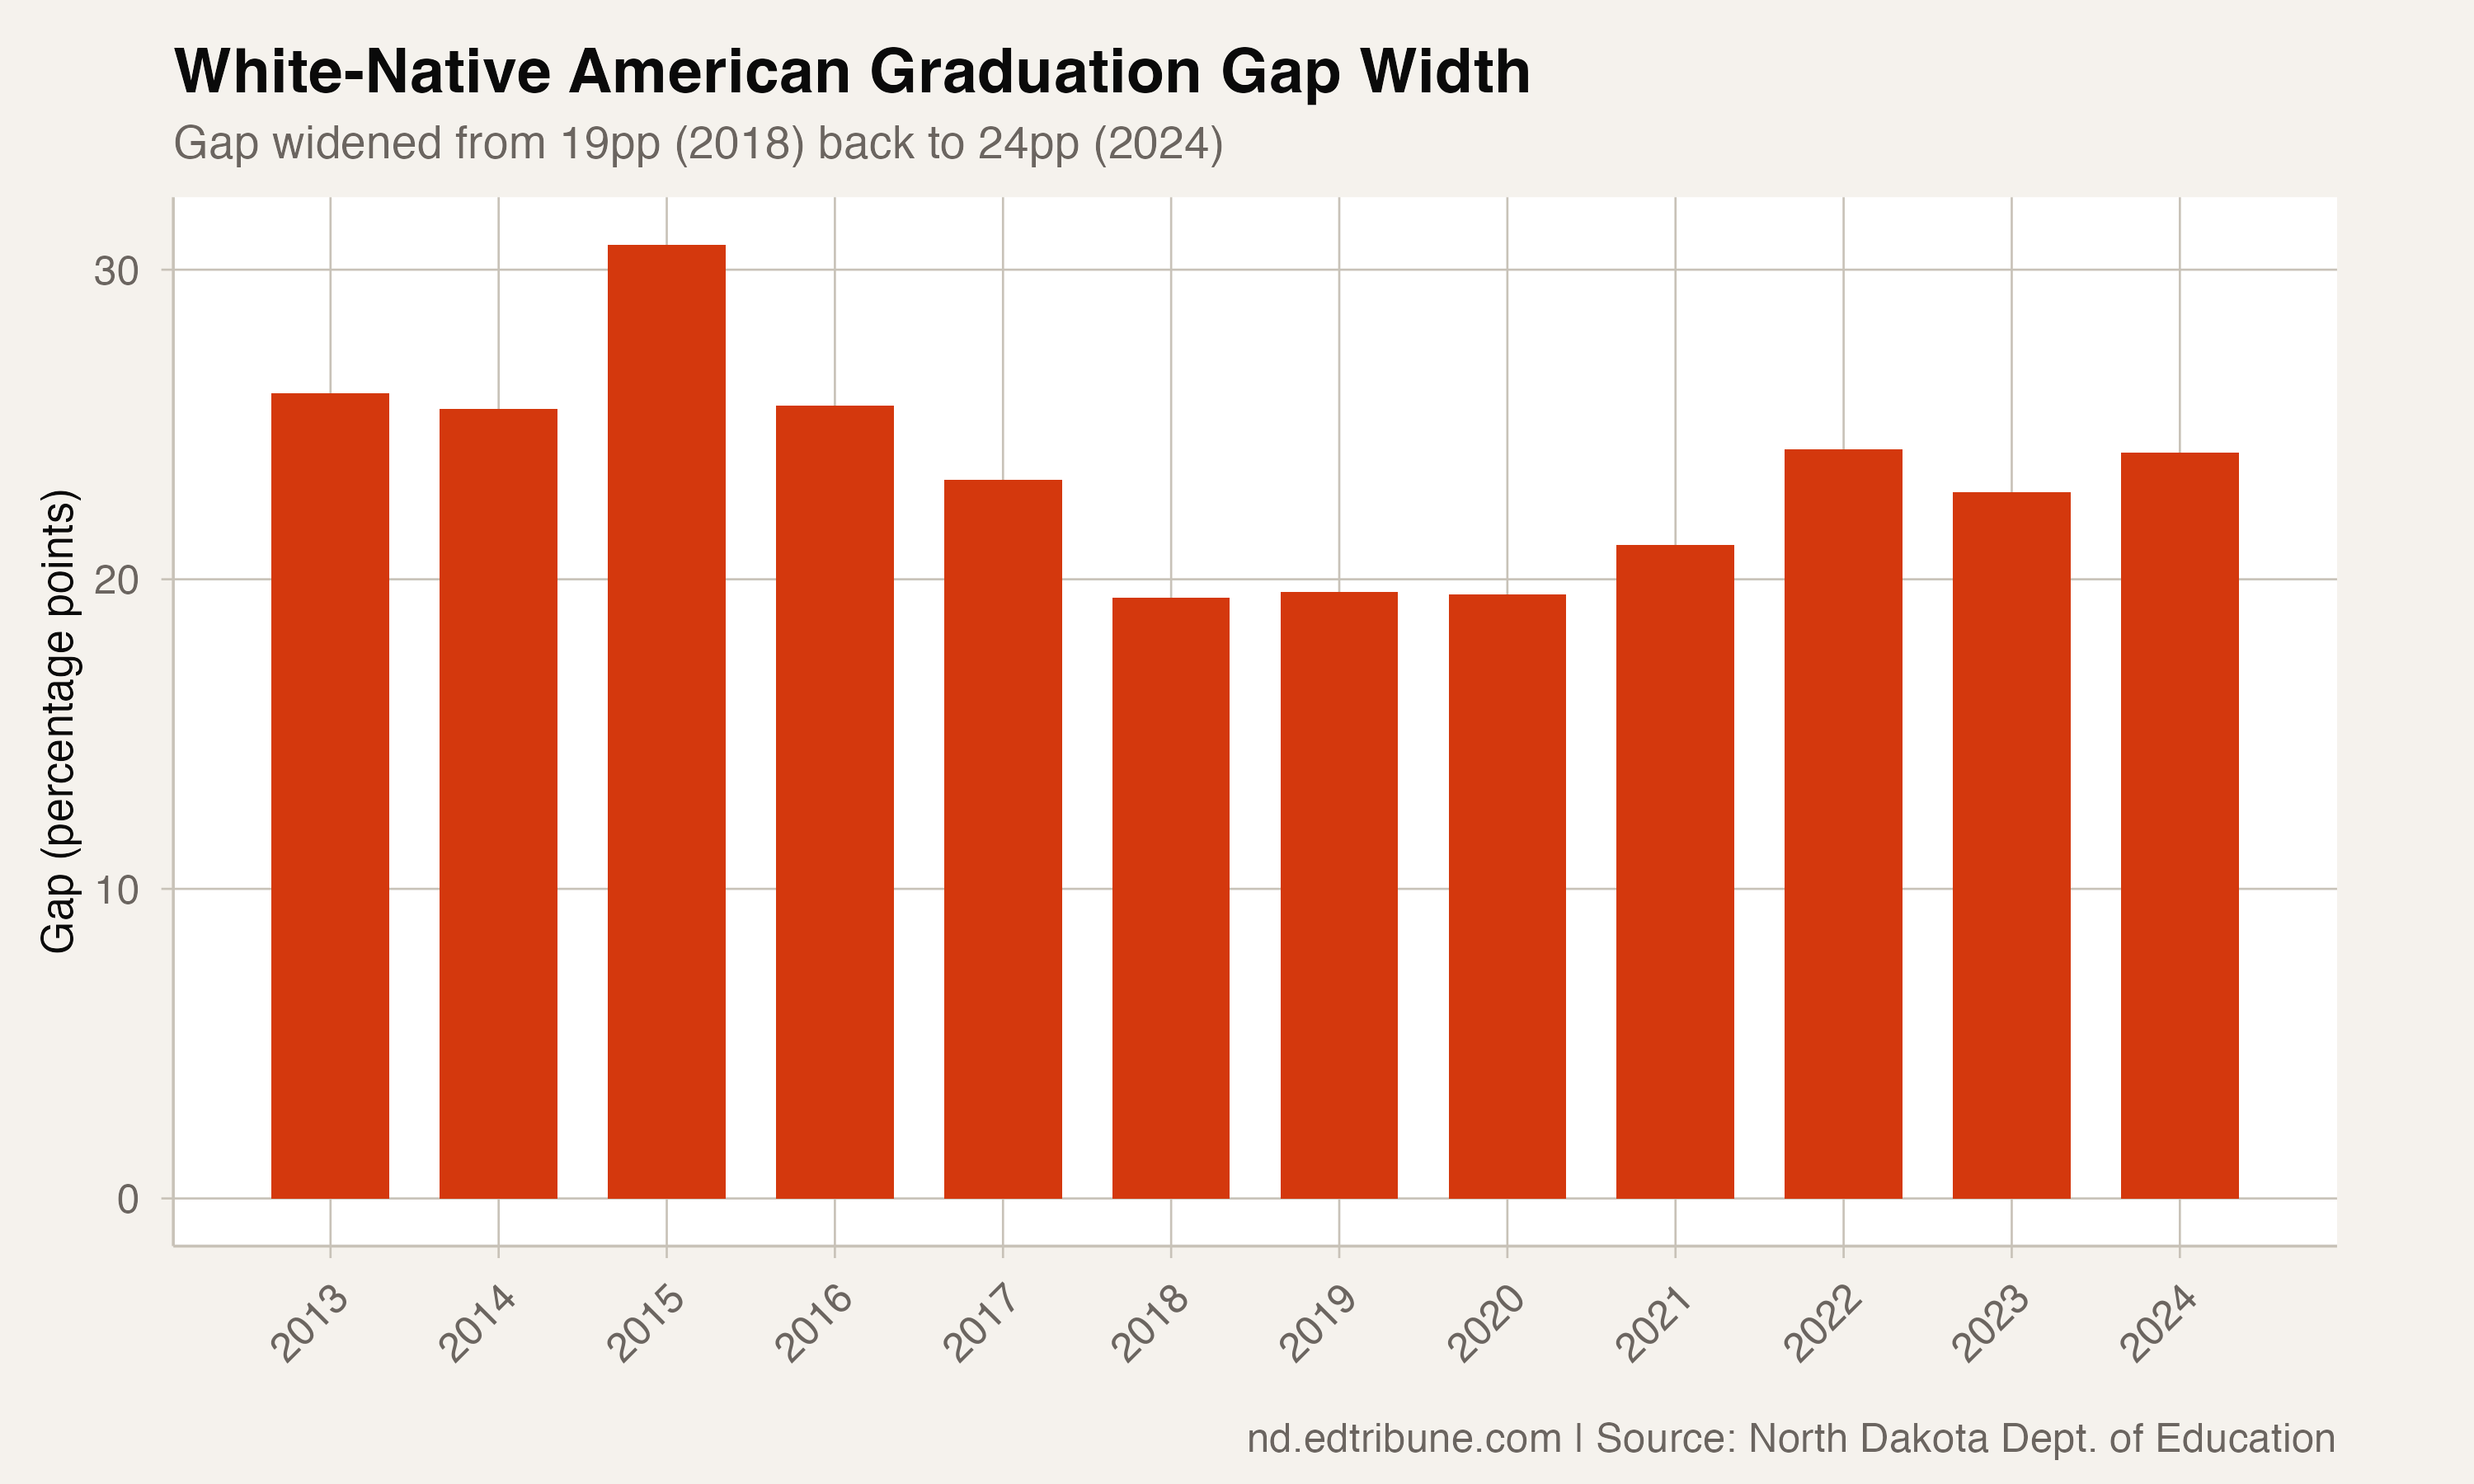
The white rate declined too, falling from 92.2% in 2020 to 87.5% in 2024. But the 4.7-point drop for white students pales beside the 9.3-point drop for Native American students over the same period. The gap is widening because the more vulnerable population is falling faster.
A growing cohort, a stagnant rate
The 939 Native American students in the 2024 graduating cohort represent 10.8% of North Dakota's statewide cohort. That share has been climbing steadily as the Native American population grows while overall demographics remain relatively flat.
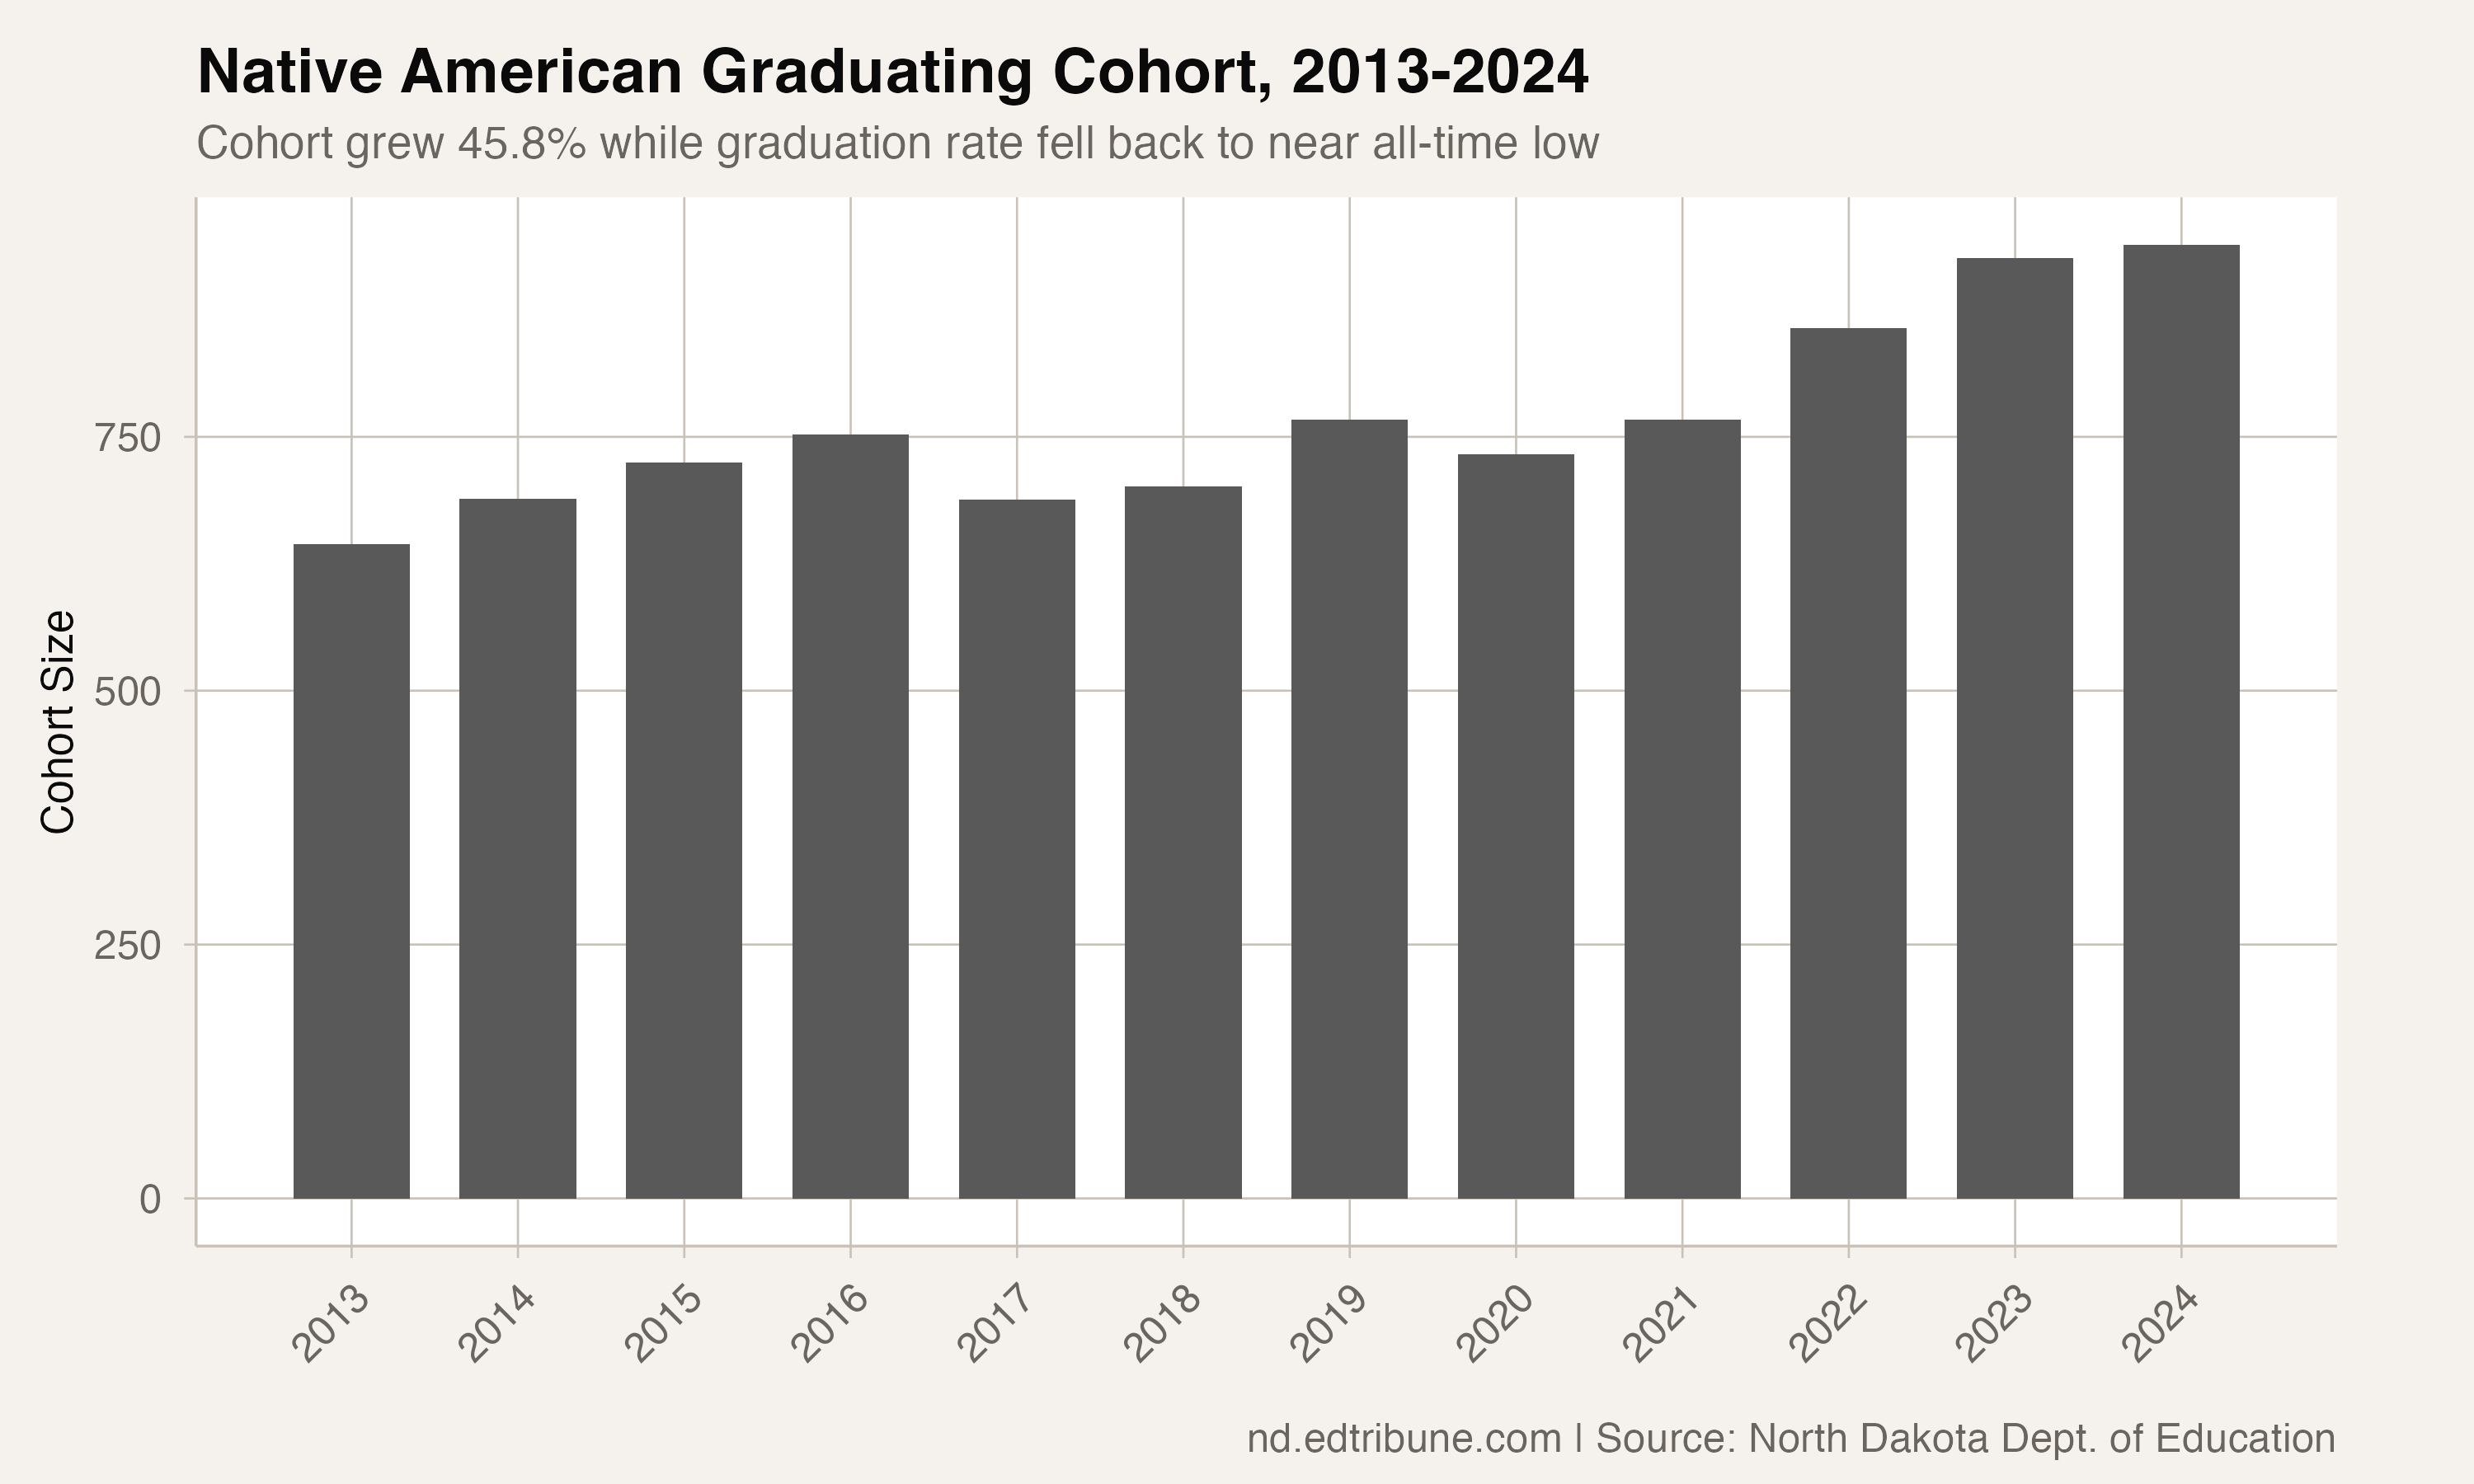
In absolute terms, approximately 595 Native American students graduated on time in 2024. If the cohort had graduated at the 2018 peak rate of 72%, that number would have been 676, a difference of 81 students in a single year. Over the four years since 2020, the cumulative gap amounts to roughly 200 students who would have earned diplomas at the earlier rate.
Where the gap manifests
The statewide number masks very different realities across districts. In Bismarck↗ET, the state capital, 53.7% of Native American students graduated. In Fargo↗ET, the largest district, the rate was 48.6%. In Minot↗ET, it was 25.9%.
Reservation-area districts tell their own story. Belcourt↗ET, on the Turtle Mountain Reservation, graduated 69% of its cohort. Fort Totten↗ET, near Spirit Lake, posted 69%. Solen↗ET, on Standing Rock, recorded 42.3%. These districts serve predominantly Native American populations and have shown no sustained improvement trend despite brief gains in the 2016-2020 period.
According to a 2024 Bureau of Indian Education report, North Dakota is among the states with a substantial number of students in BIE-funded schools. Transportation, internet access, and gaps in culturally specific programming remain persistent barriers to completion for Native American students.
The context behind the numbers
The 2020 peak in graduation rates across all subgroups likely reflected pandemic-era accommodations, including relaxed requirements and expanded credit recovery. As those accommodations ended, the underlying challenges resurfaced, and they resurfaced more severely for populations with fewer resources to absorb the transition.
North Dakota's "Choice Ready" accountability system tracks graduation rate as one of several indicators. But accountability frameworks operate at the state and district level. For Native American students, the barriers to graduation often trace to factors outside school walls: poverty, housing instability, the legacy of boarding schools, and the simple geography of reservation life in a state where a bus ride to school can take 90 minutes each way.
The gap that briefly narrowed was not imagined. Something worked between 2013 and 2018. Understanding what changed, and why those gains proved so fragile, may matter more than the 24-point number itself.
Data from the North Dakota Department of Public Instruction. Graduation rates represent four-year cohort rates. All years use the end-year convention (2024 = class of 2024).
Detailed code that reproduces the analysis and figures in this article is available exclusively to EdTribune subscribers.
Discussion
Sign in to join the discussion.
Loading comments...