Correction: An earlier preview compared districts by name, mixed incomplete merger histories into long-run rankings, and included causal, fiscal, and forecast claims that the enrollment data could not verify. This version uses a complete stable-ID panel and observed enrollment only.
North Dakota public school enrollment rose from 94,052 students in 2008 to 116,365 in 2026, an increase of 22,313, or 23.7%. The statewide gain was large. Its distribution was narrow.
Ten districts accounted for 74.2% of all positive enrollment gains in a panel of 158 district IDs reported in every year. West Fargo↗ET alone added 7,032 students, or 29.6% of those gains.
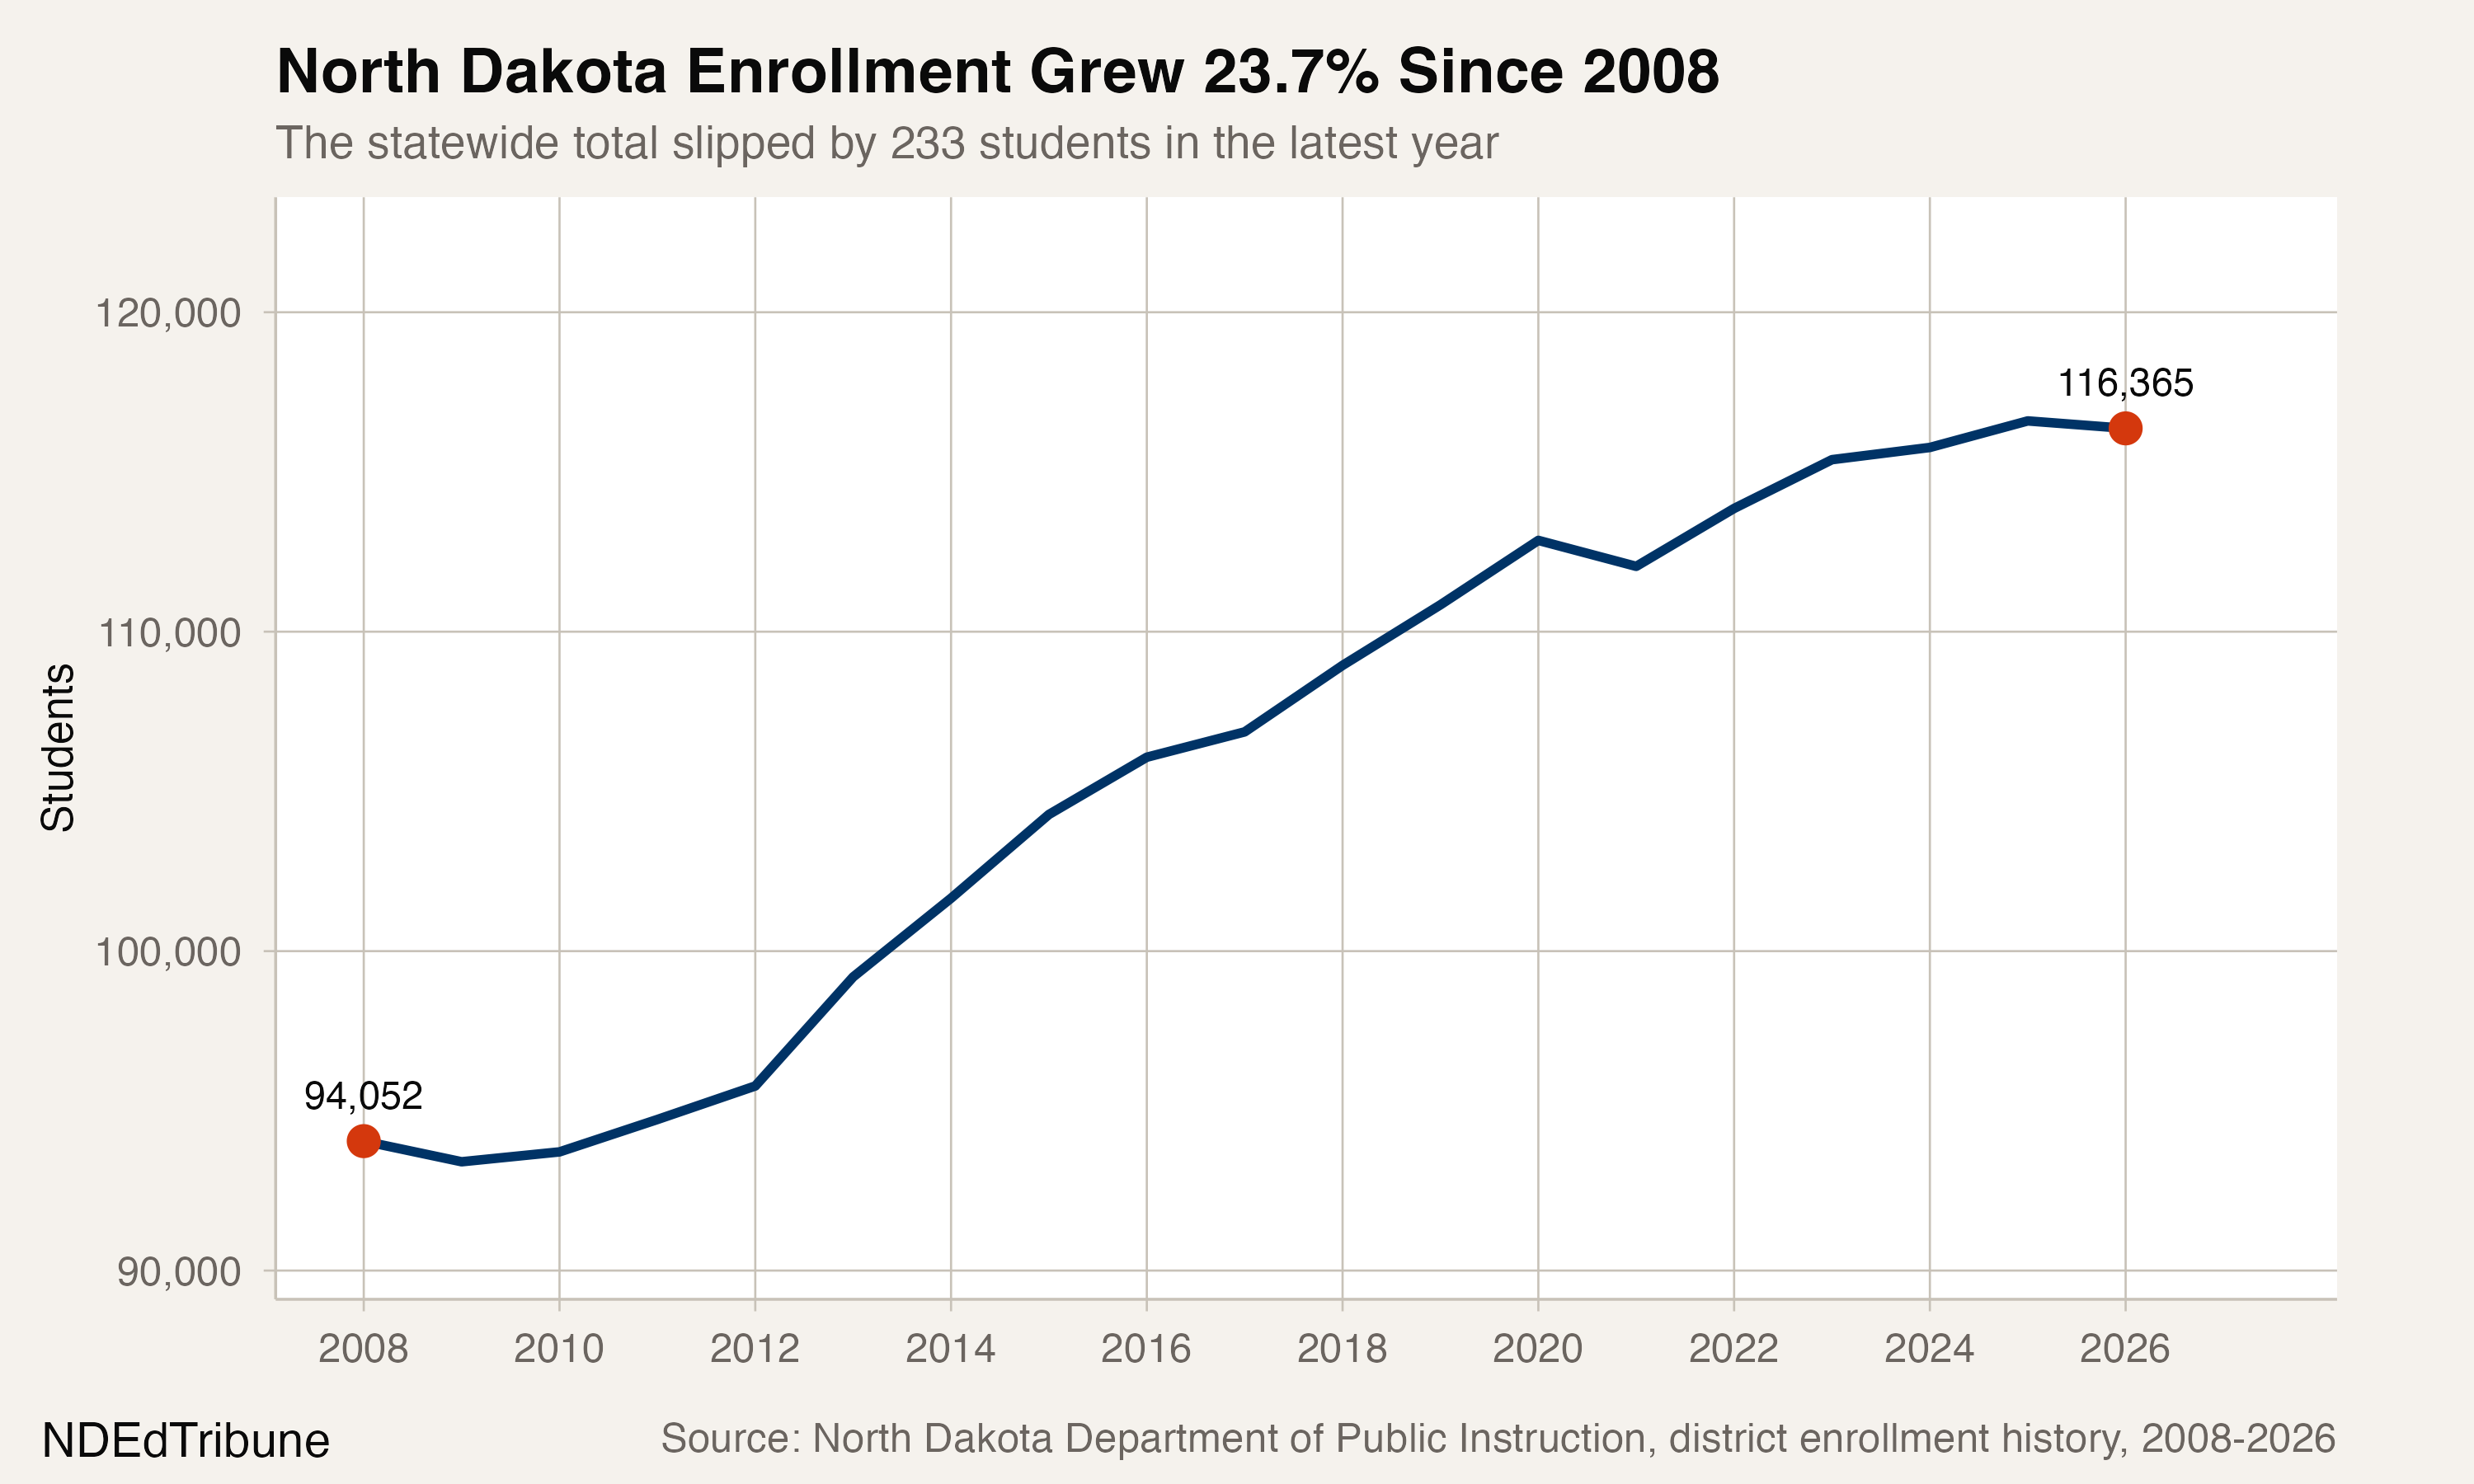
A statewide rise with one recent dip
The statewide total slipped by 233 students in 2026, a 0.2% decrease after four consecutive annual gains. That latest change was small beside the 23.7% increase across the full 2008-2026 window.
Long-run district comparisons require a narrower universe than the statewide line. The complete panel contains 158 stable district IDs, compared with 165 district IDs reported in 2026. It covers 93.8% of statewide enrollment at the beginning of the period and 93.4% at the end.
Seven current IDs do not have a complete record across all 19 reporting years and are excluded from the district rankings. That group includes Williston Basin. The analysis does not combine a current district with predecessor systems or assume that matching names describe the same entity.
Within the complete panel, enrollment grew by 20,453. Eighty-four districts gained students, 72 lost students and two were unchanged. The growing districts added 23,748 students in all, while losses elsewhere removed 3,295.
West Fargo set the scale
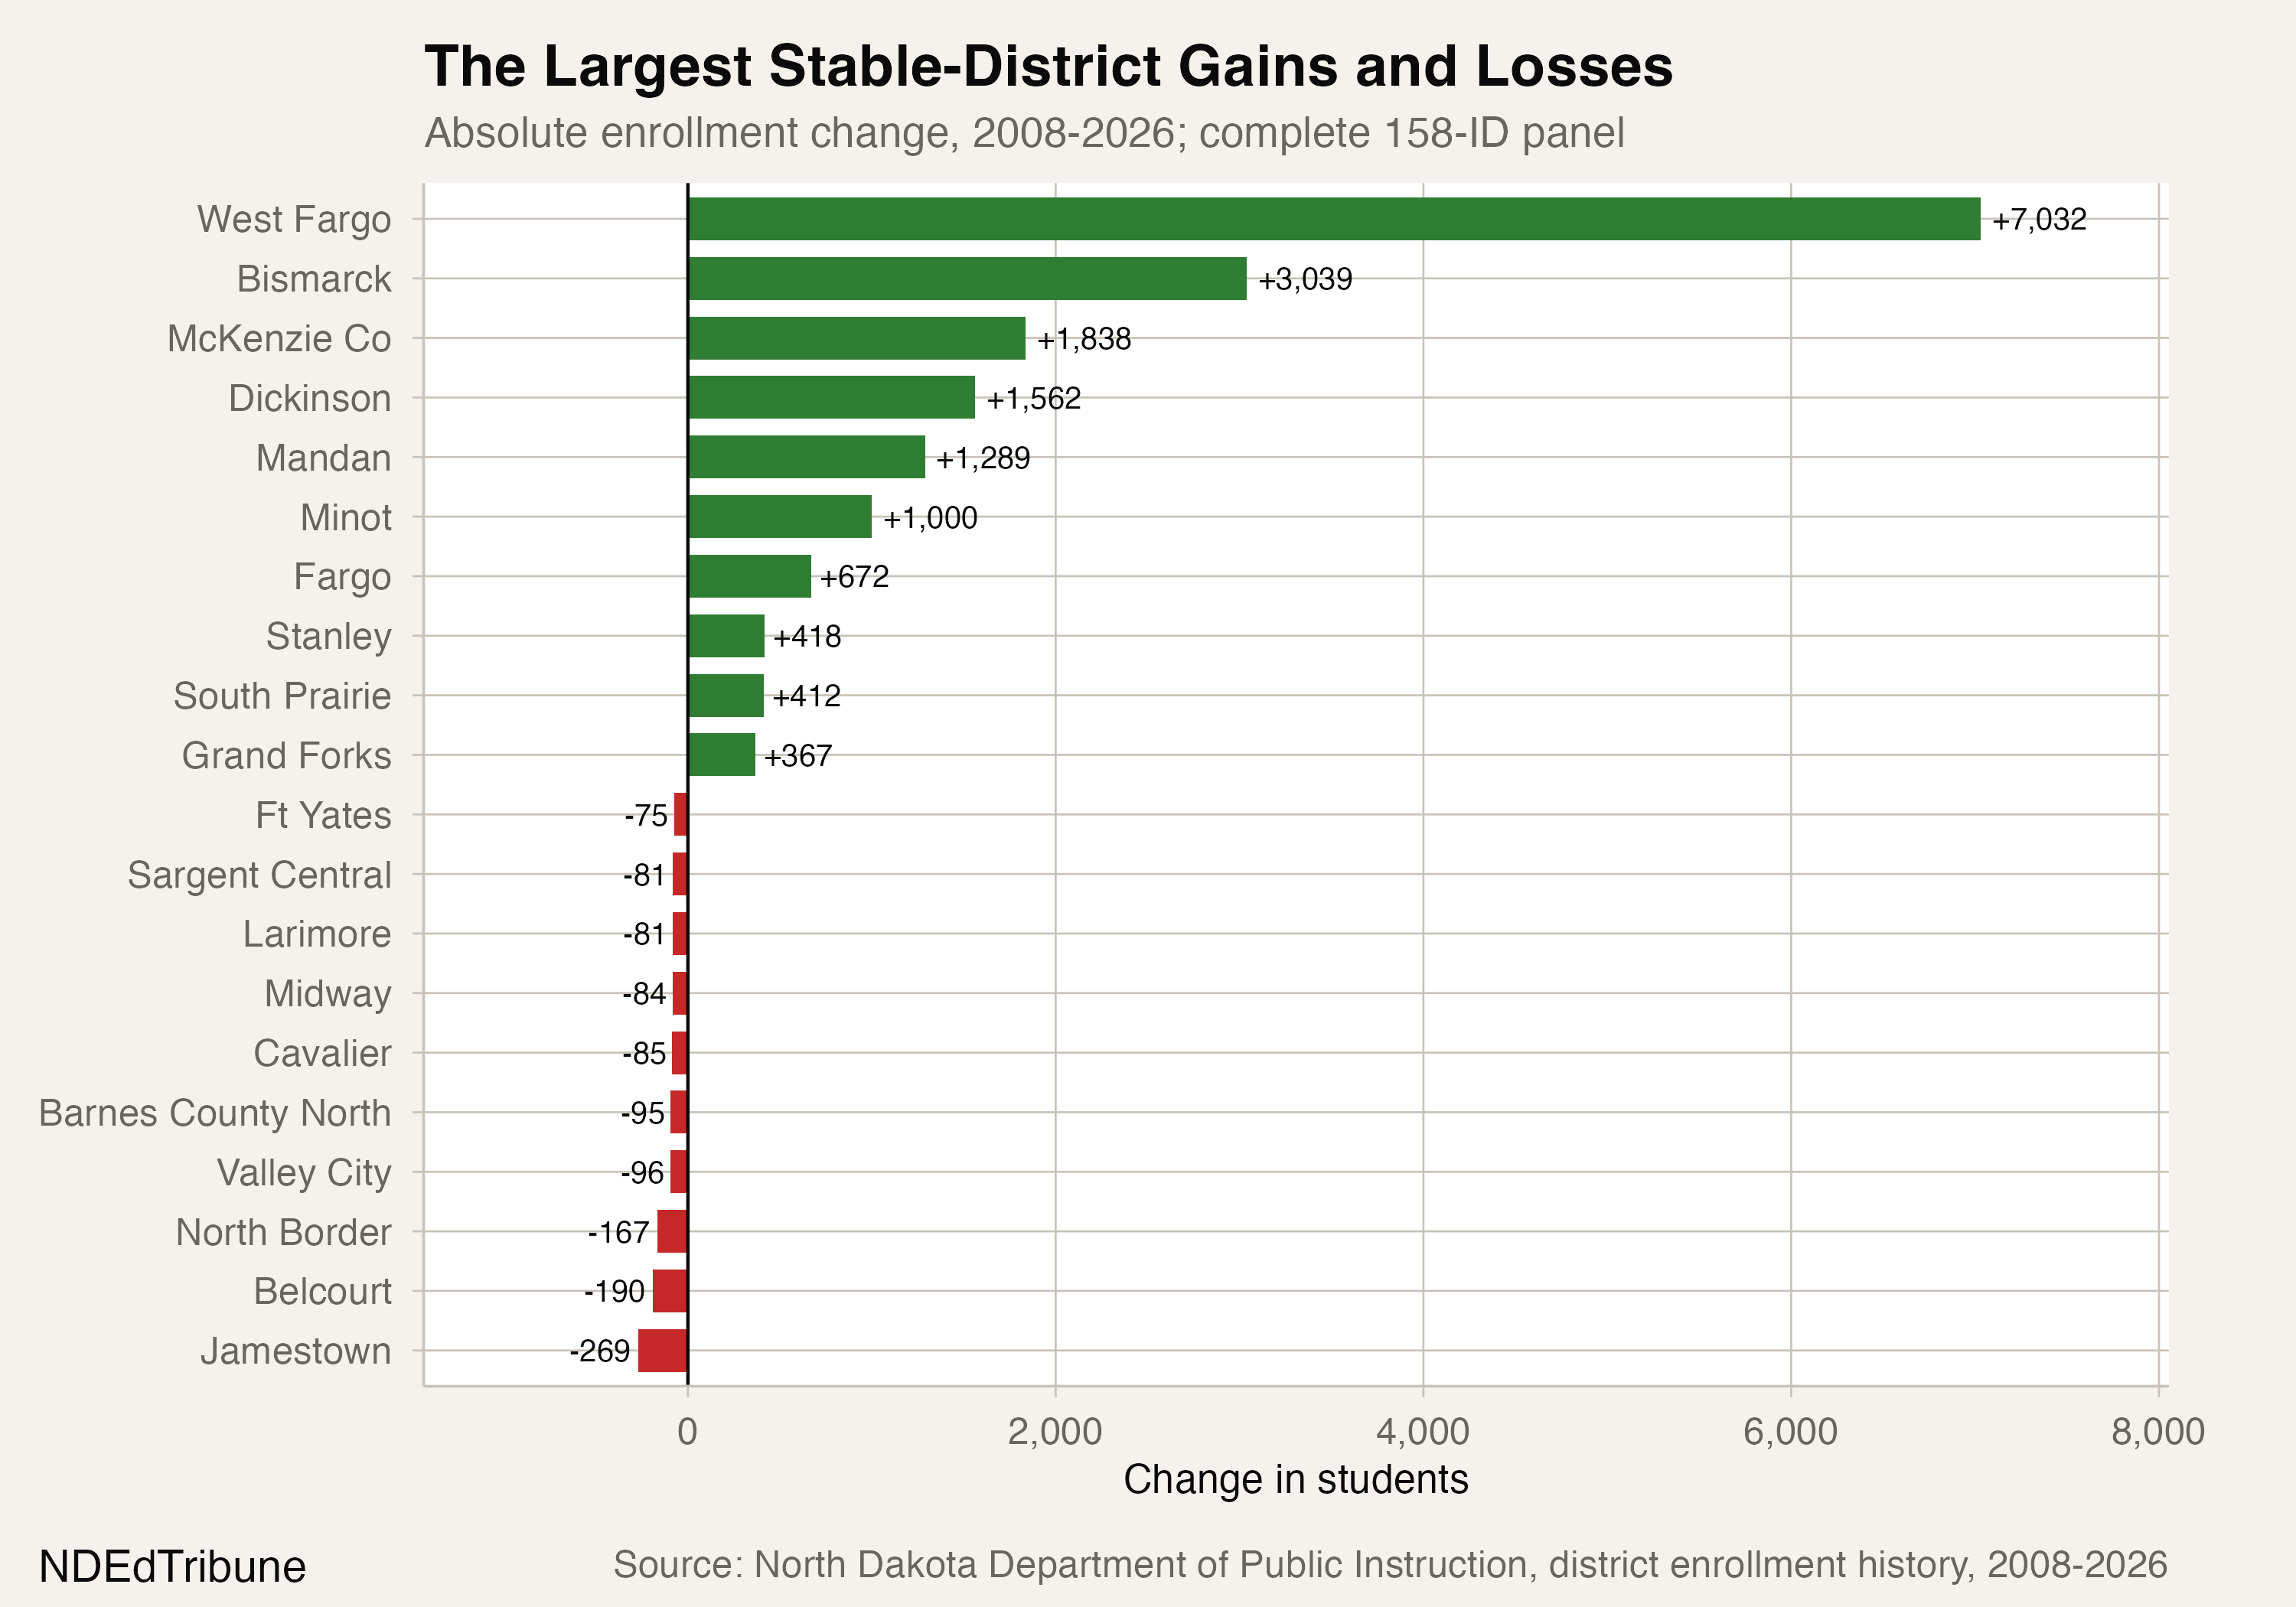
West Fargo grew from 6,179 students to 13,211, a gain of 7,032, or 113.8%. No other district in the complete panel added as many students.
Bismarck added 3,039, McKenzie County added 1,838, Dickinson added 1,562 and Mandan added 1,289. Together with West Fargo, those five districts accounted for 62.2% of all positive gains in the panel.
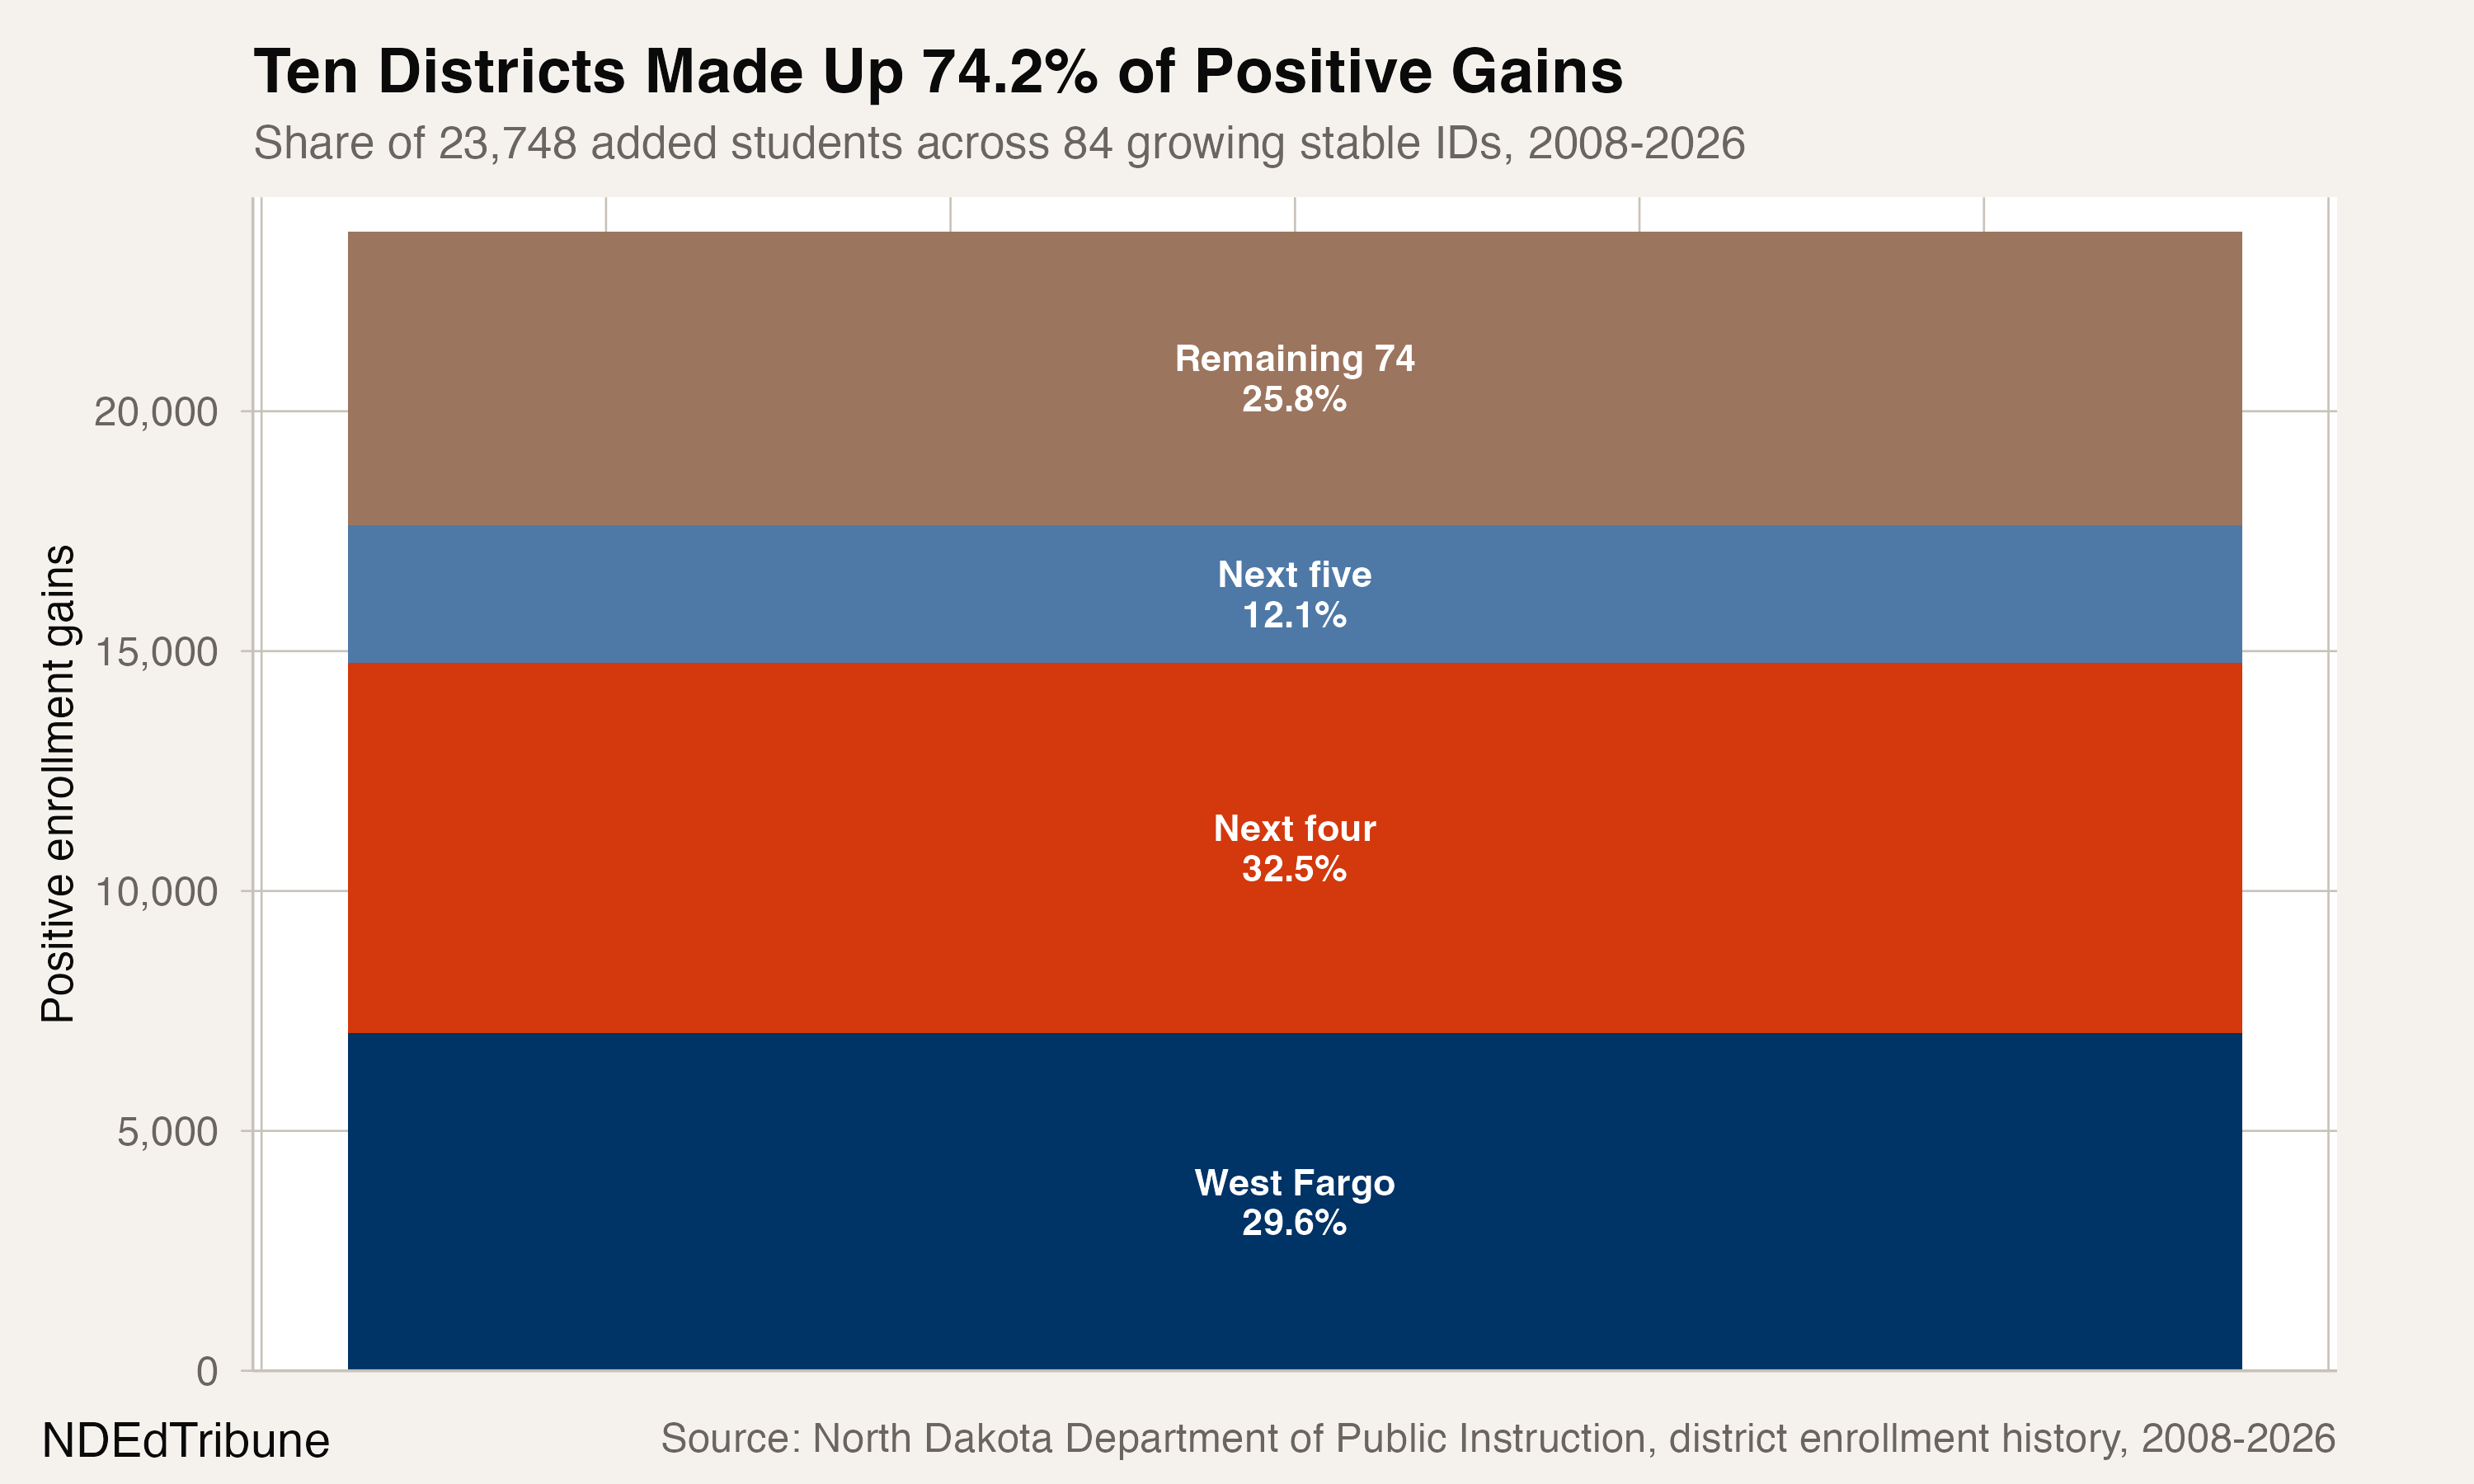
The headline ranks absolute gains, not percentage growth. That choice matters: only two districts appear in both the ten largest absolute gains and the ten largest percentage gains. The analysis uses no minimum-enrollment cutoff.
Losses were spread more widely
The ten largest declines accounted for 37.1% of the panel's 3,295 lost students. Jamestown↗ET had the largest decline, down 269 students, or 8.2% of all losses. Belcourt lost 190 and North Border lost 167.
The latest year also placed 22 stable district IDs at their highest enrollment in the available panel and 22 at their lowest. The test counts a district when its 2026 value equals its maximum or minimum from 2008 through 2026; a repeated extreme counts as a tie.
The source reported 194 district rows in 2008 and 165 in 2026, a difference of 29. That is a count of reported entities, not a consolidation total. The stable-ID panel excludes non-comparable histories instead of assigning every change in that count to one cause.
What enrollment alone cannot explain
The enrollment file does not contain population, housing, migration, district-boundary or birth data. Those factors remain unresourced explanations here. A stable identifier avoids name-based matching, but it does not prove that a district's organization or boundaries stayed unchanged.
The measured contrast is narrower: most long-run gains sit in a small group of continuously reported districts, while declines are distributed across a much larger set. That concentration is how a statewide total can rise even when many districts move in the other direction.
The NDEdTribune contacted representatives of West Fargo Public Schools and Jamestown Public School District for comment and did not receive a response before publication.
Enrollment figures come from the North Dakota Department of Public Instruction's district enrollment history, covering 2008 through 2026.
Detailed code that reproduces the analysis and figures in this article is available exclusively to EdTribune subscribers.
Discussion
Sign in to join the discussion.
Loading comments...