Between 2008 and 2019, North Dakota added an average of 1,526 students a year. The Bakken oil boom filled western classrooms. Fargo's suburbs pushed east. Enrollment climbed from 94,052 to 110,842, a 17.9% surge that made it one of the fastest-growing states in the country.
If that pace had held, North Dakota would have had 122,701 students in 2025-26. It had 116,365. The 6,336-student shortfall works out to roughly $71.9 million in annual per-pupil funding at the state's current rate of $11,349 per student. And the gap is getting worse fast: it grew by nearly 2,000 students in a single year, from 4,351 in 2025 to 6,336 in 2026.
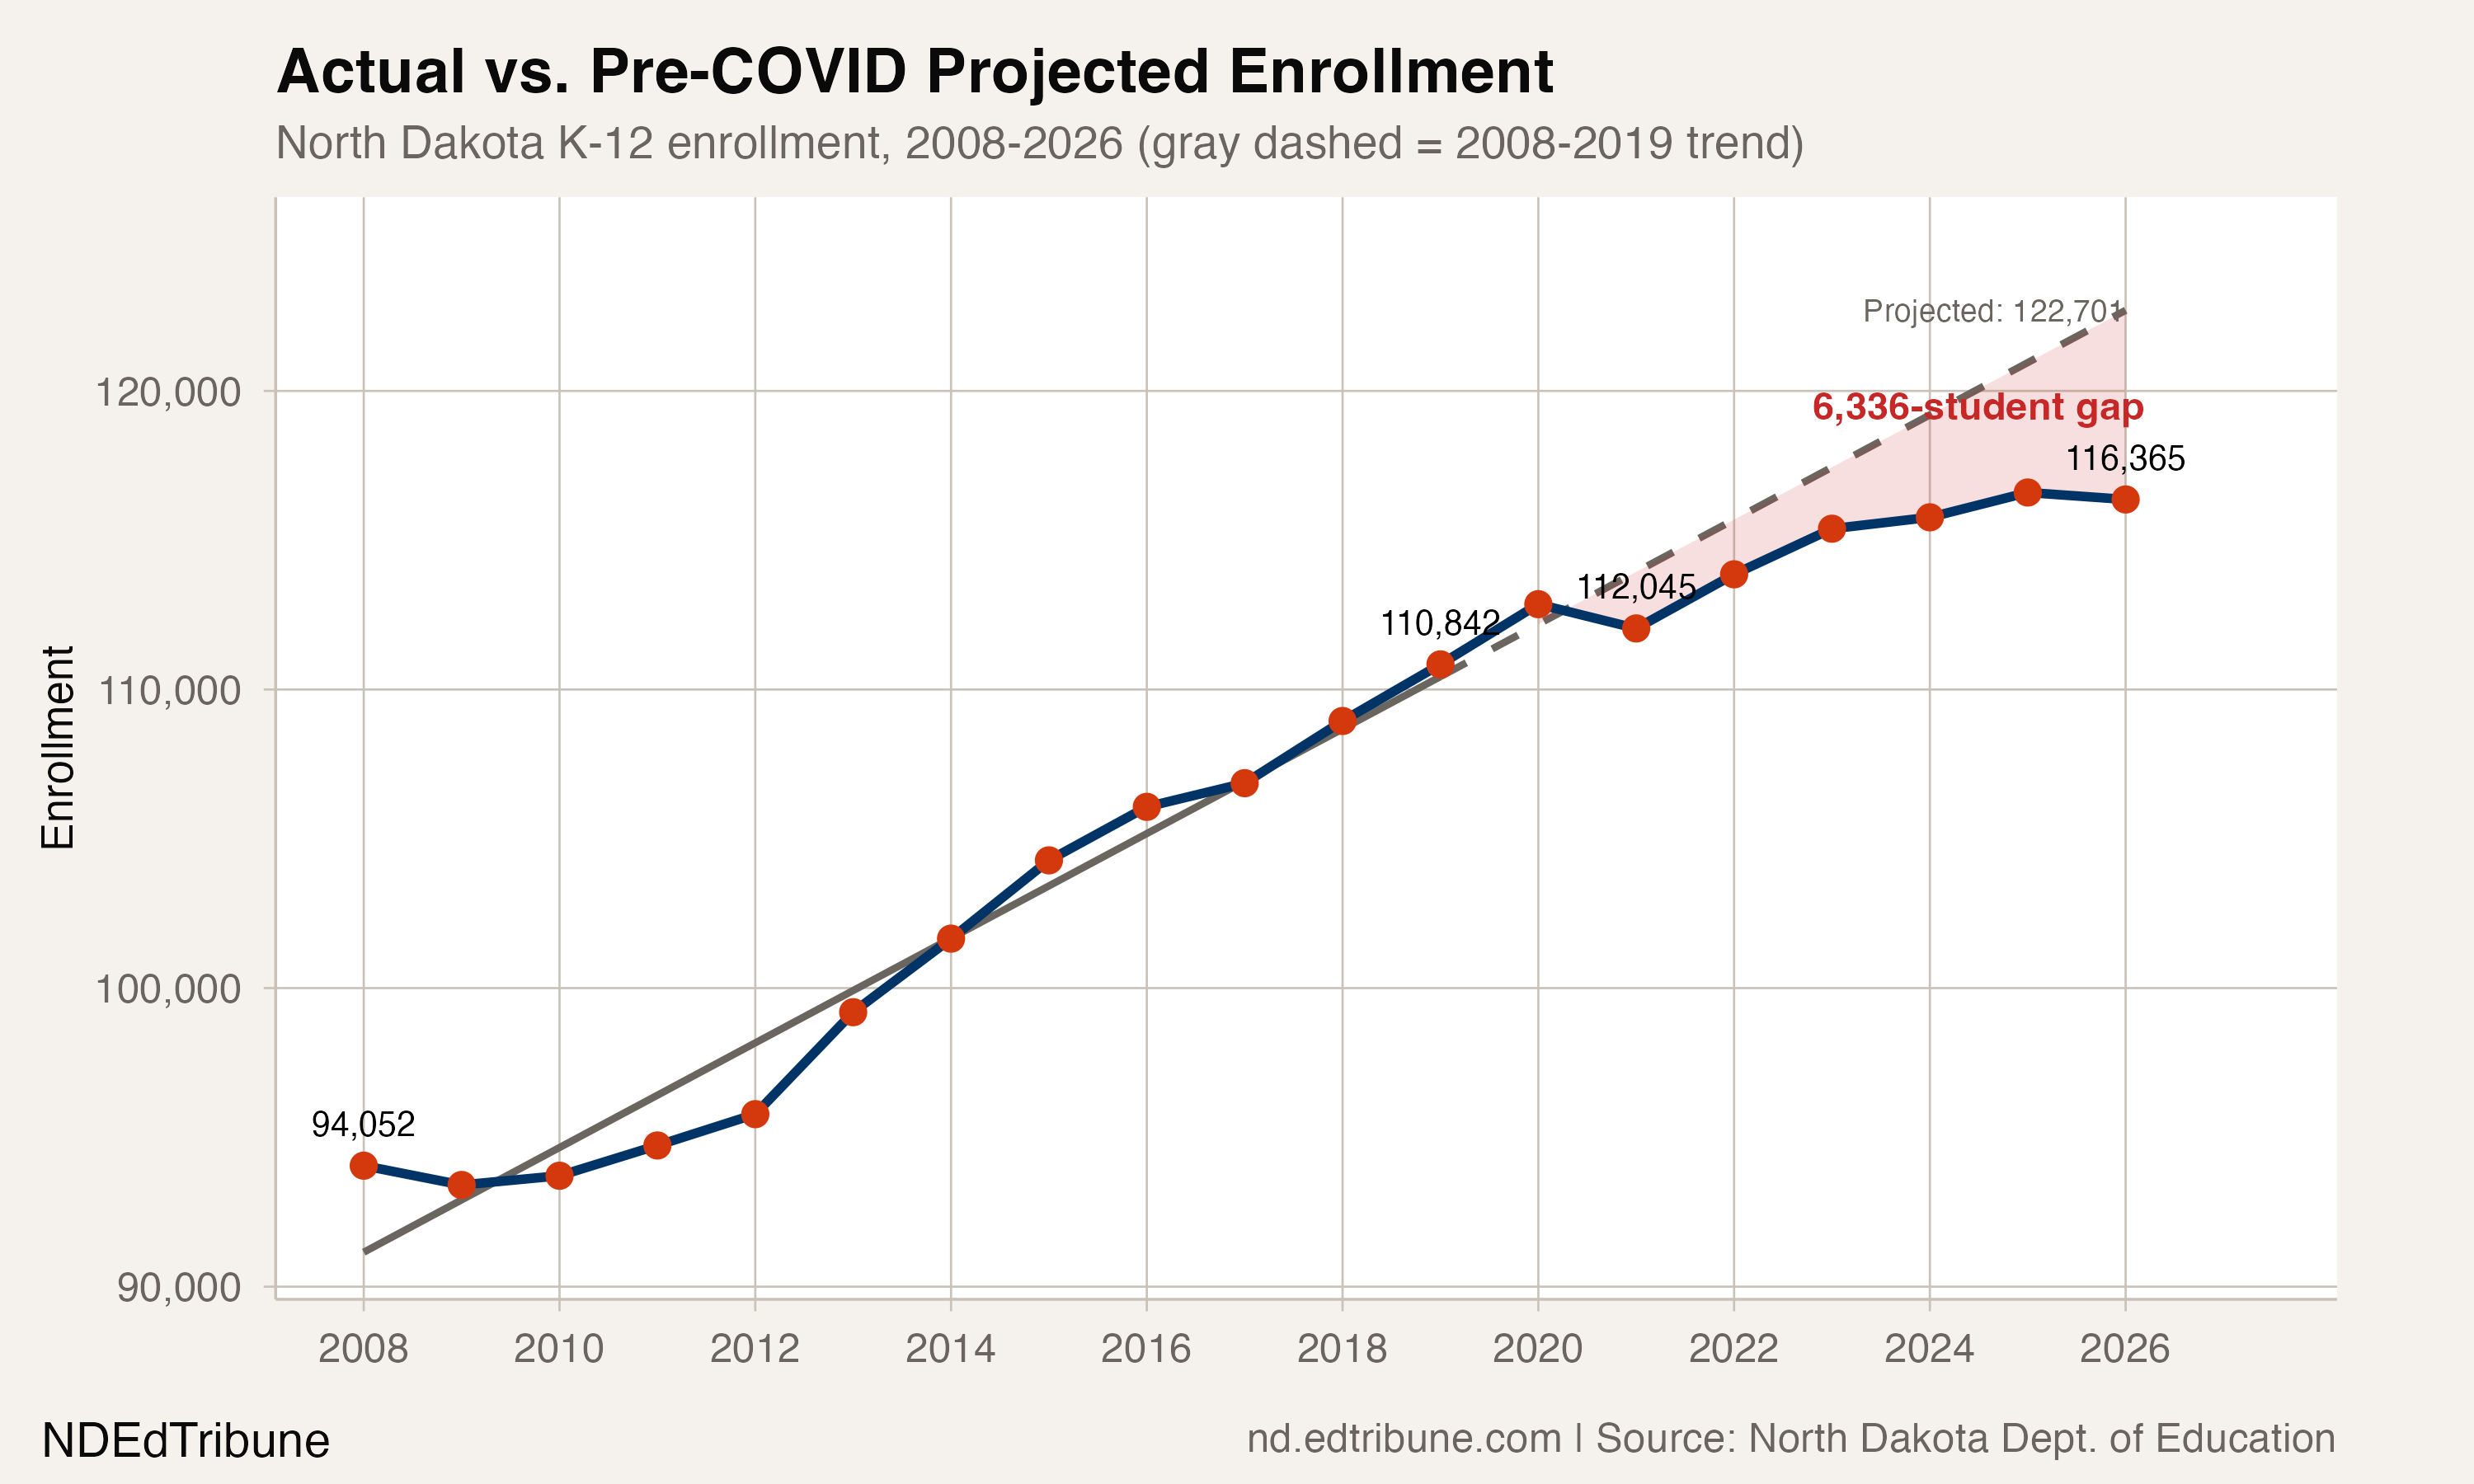
A gap that did not exist in 2020
The projection is simple: a linear fit to the 12 years from 2008 through 2019, which explains 95.6% of the variation. The trend line added roughly 1,753 students per year.
Through 2020, North Dakota was actually ahead of that line, 672 more students than projected, carried by a final pre-pandemic surge of 2,016. Then 2021 hit. The pandemic wiped out 813 students in a single year, and the state never got back on track.
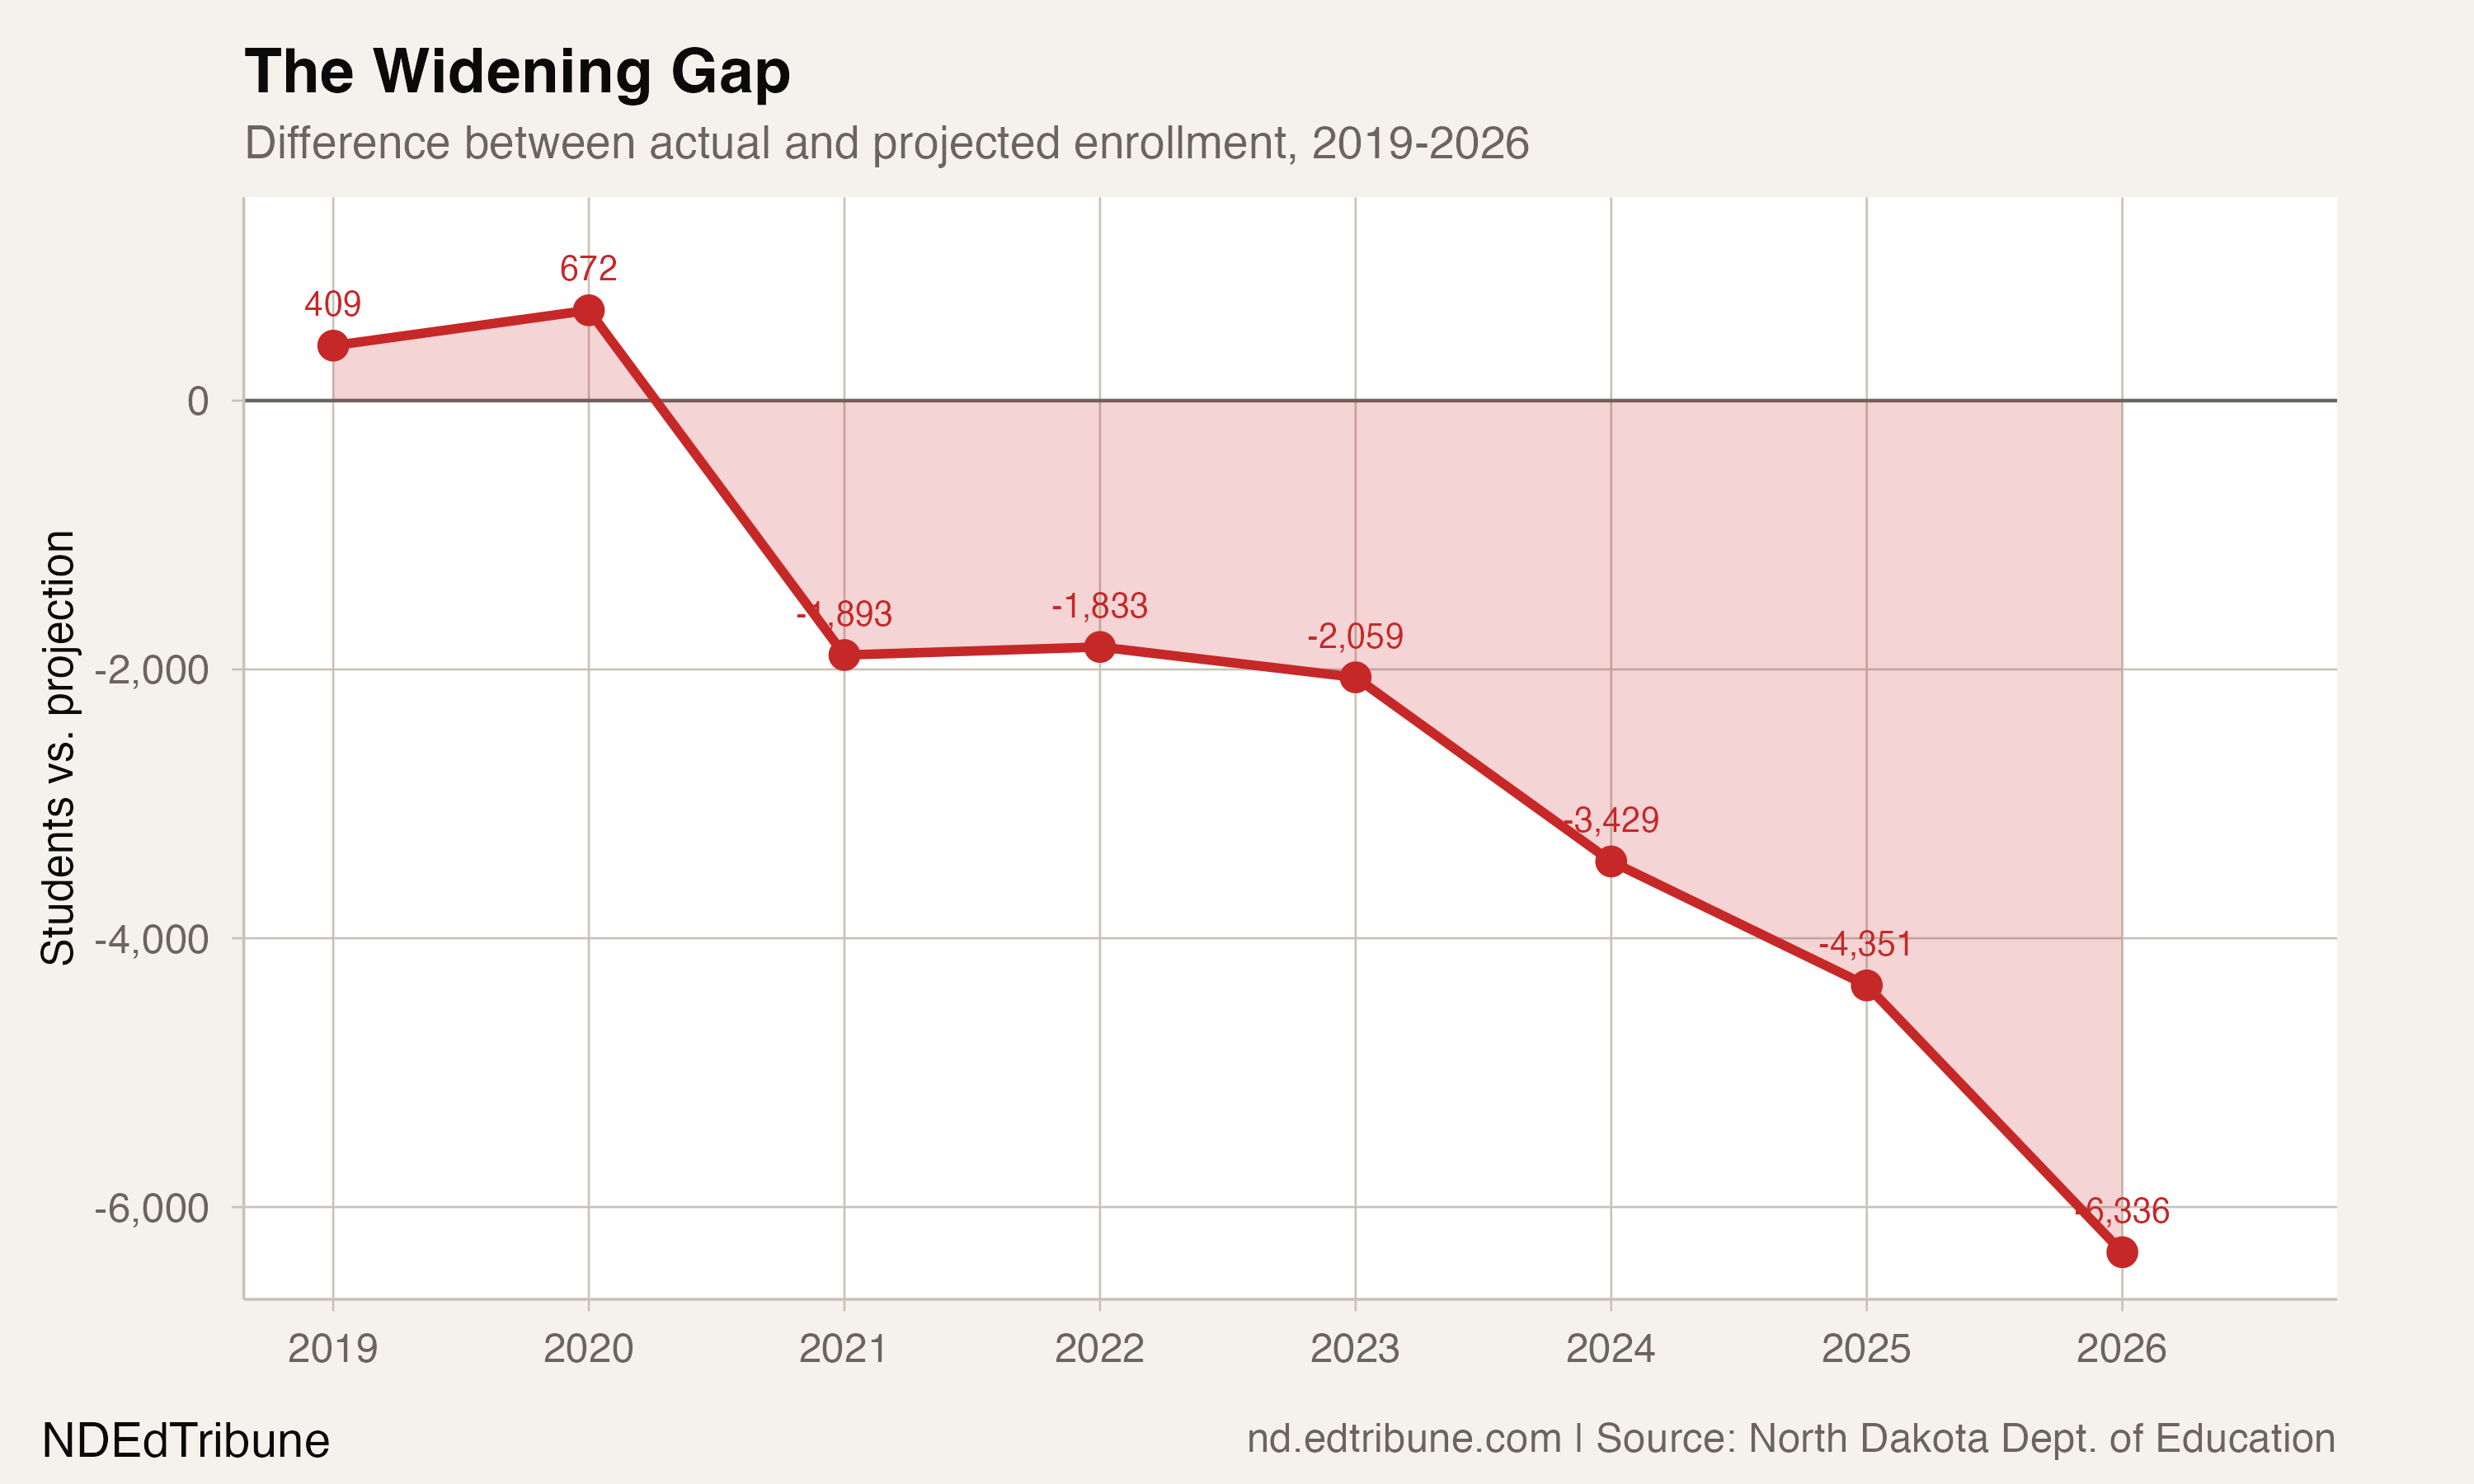
The recovery was real but not enough. North Dakota bounced back with gains of 1,813 (2022) and 1,527 (2023), numbers that would have been healthy in any prior decade. But closing the gap required 1,753 per year just to stay level. By 2024, annual growth had slowed to 382. By 2026, it turned negative.
The cumulative toll is steeper than any single year suggests. Over six years since the pandemic, North Dakota has fallen short of its trend line by a combined 19,901 student-years, an aggregate funding gap of roughly $225.9 million.
The deceleration is visible year by year
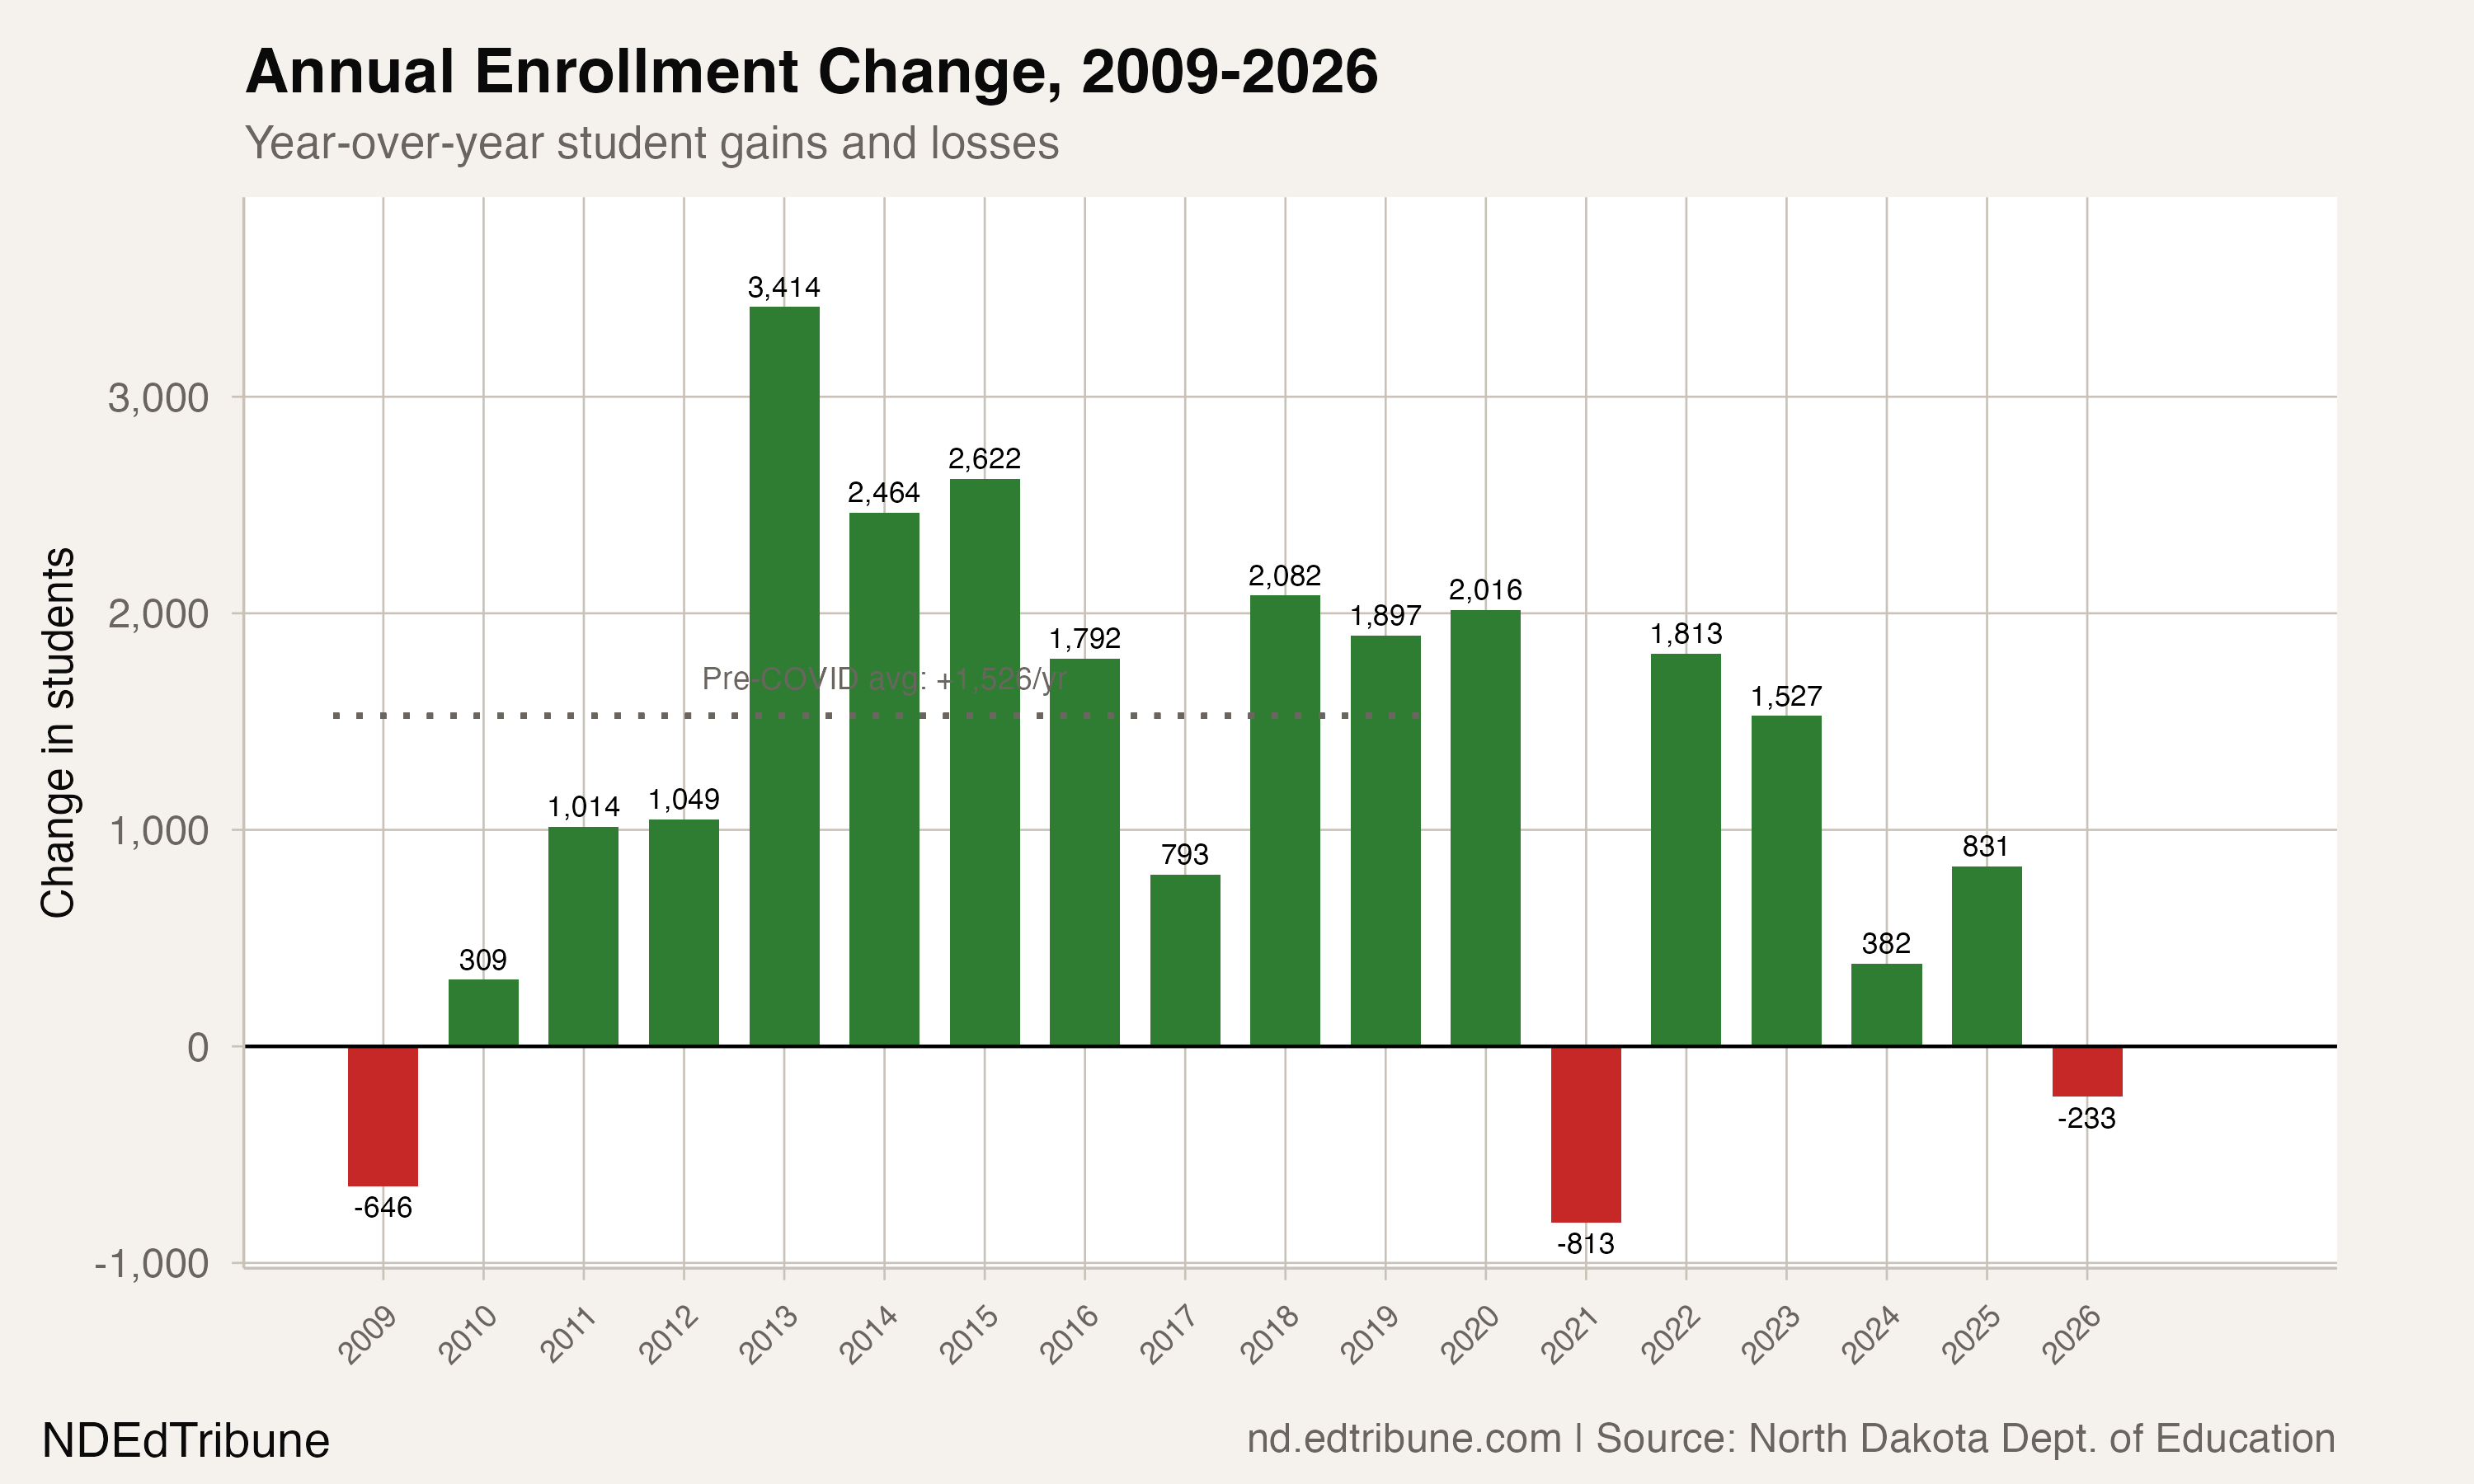
From 2009 through 2020, North Dakota posted gains in 11 of 12 years. The average was 1,526 per year, powered by a boom-era peak of 3,414 in 2013 when Bakken drilling was at its most intense. Since 2020, the average has fallen to 584 per year, and the most recent year turned negative for only the second time since 2009.
This is not a sudden collapse. After the pandemic dip of -813 in 2021, gains recovered to 1,813 and then 1,527 before dropping sharply: 382, 831, -233. A steady fade, with the one uptick in 2025 (+831) not nearly enough to reverse the broader direction.
Five districts account for most of the shortfall
The 6,336-student statewide gap is not spread evenly. Of 161 districts with enough history to model, 93 sit below their pre-COVID projection and 67 sit above. But the shortfall piles up at the top.
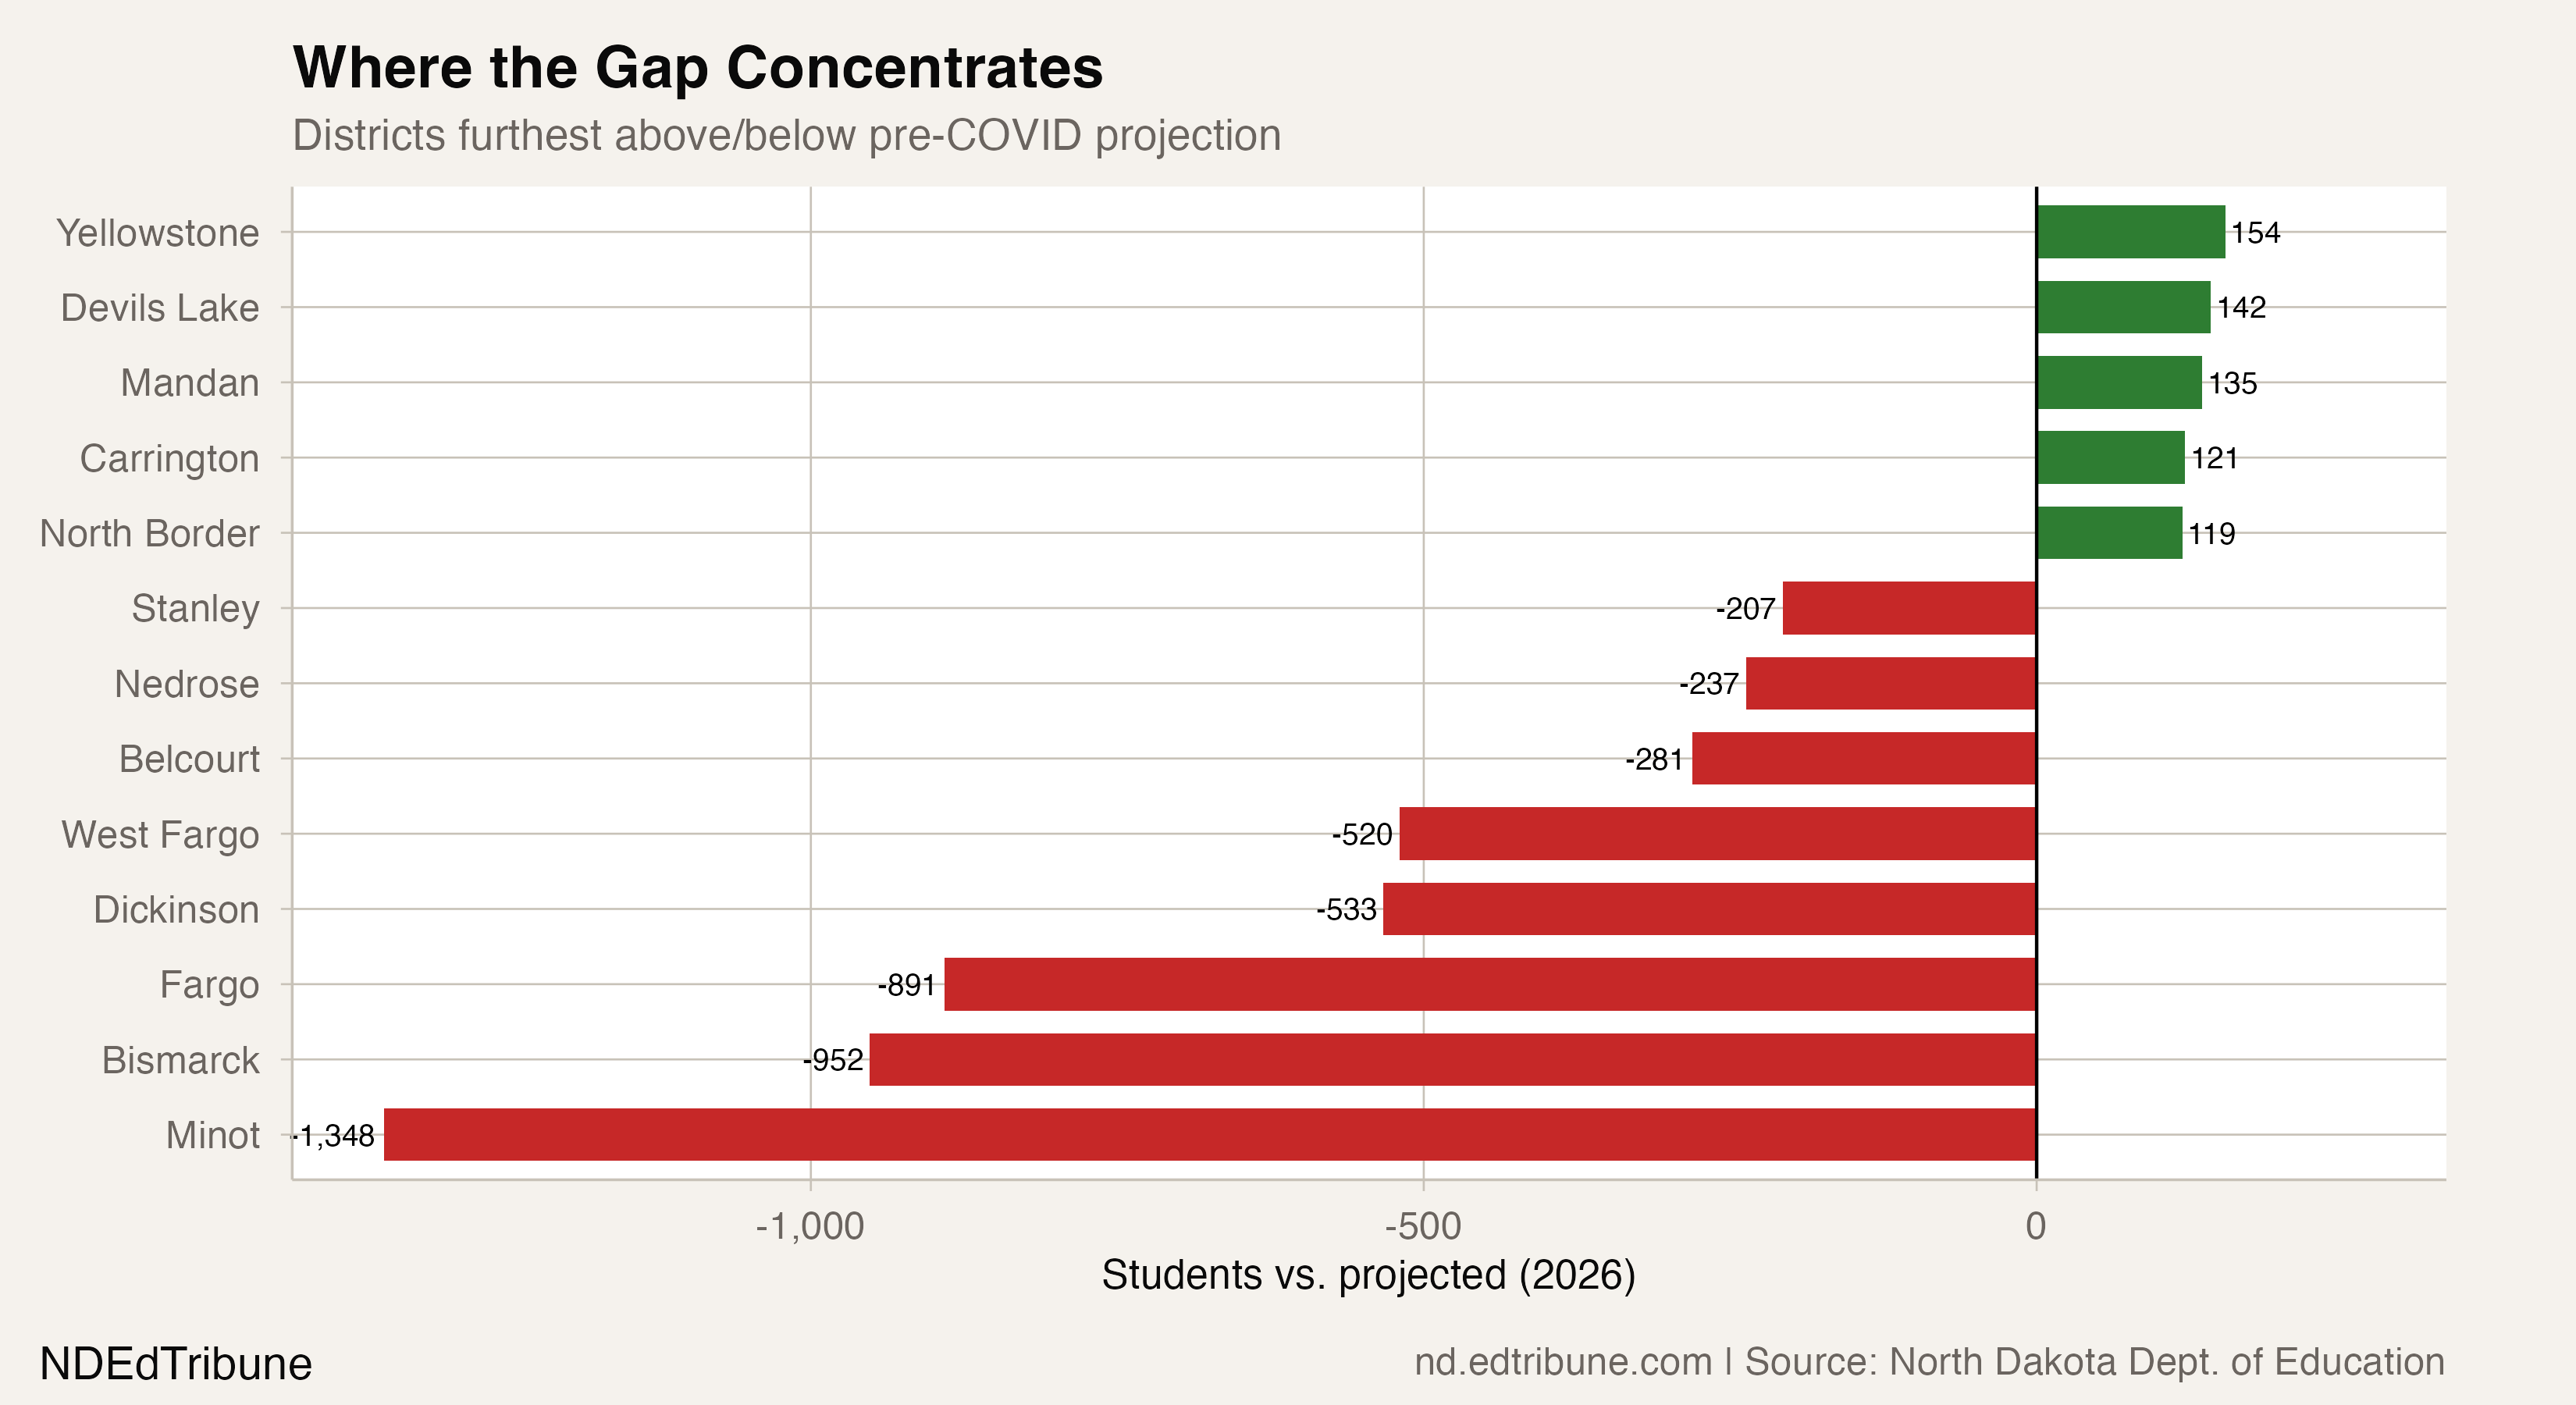
Minot 1↗ET is the single largest contributor, running 1,348 students below its projected enrollment. Minot's pre-COVID trend added 118 students per year. The district peaked at 7,723 in 2015 and has since fallen to 7,243, a decline that began well before the pandemic but accelerated after it. Bismarck 1↗ET trails its projection by 952 students, and Fargo 1↗ET by 891. Dickinson 1↗ET, another oil-patch district, falls 533 short. Even West Fargo 6↗ET, the state's fastest-growing district for 18 consecutive years, sits 520 below where its pre-COVID trajectory projected it would be.
Those five districts alone account for 4,244 of the 6,336-student statewide gap, 67.0% of the total.
On the other side of the ledger, Mandan 1↗ET (+135) and Devils Lake 1↗ET (+142) are among the few mid-sized districts outpacing their pre-COVID trend. Several small rural districts, including Yellowstone 14 (+154) and Carrington 49 (+121), also beat their projections, though in some cases the "projection" reflected a pre-COVID decline that has since reversed.
Fewer entering than exiting
Beneath the topline gap sits a structural warning. In 2026, North Dakota enrolled 8,361 kindergartners and 8,400 twelfth graders. More students are walking out the door with diplomas than walking in for the first time.
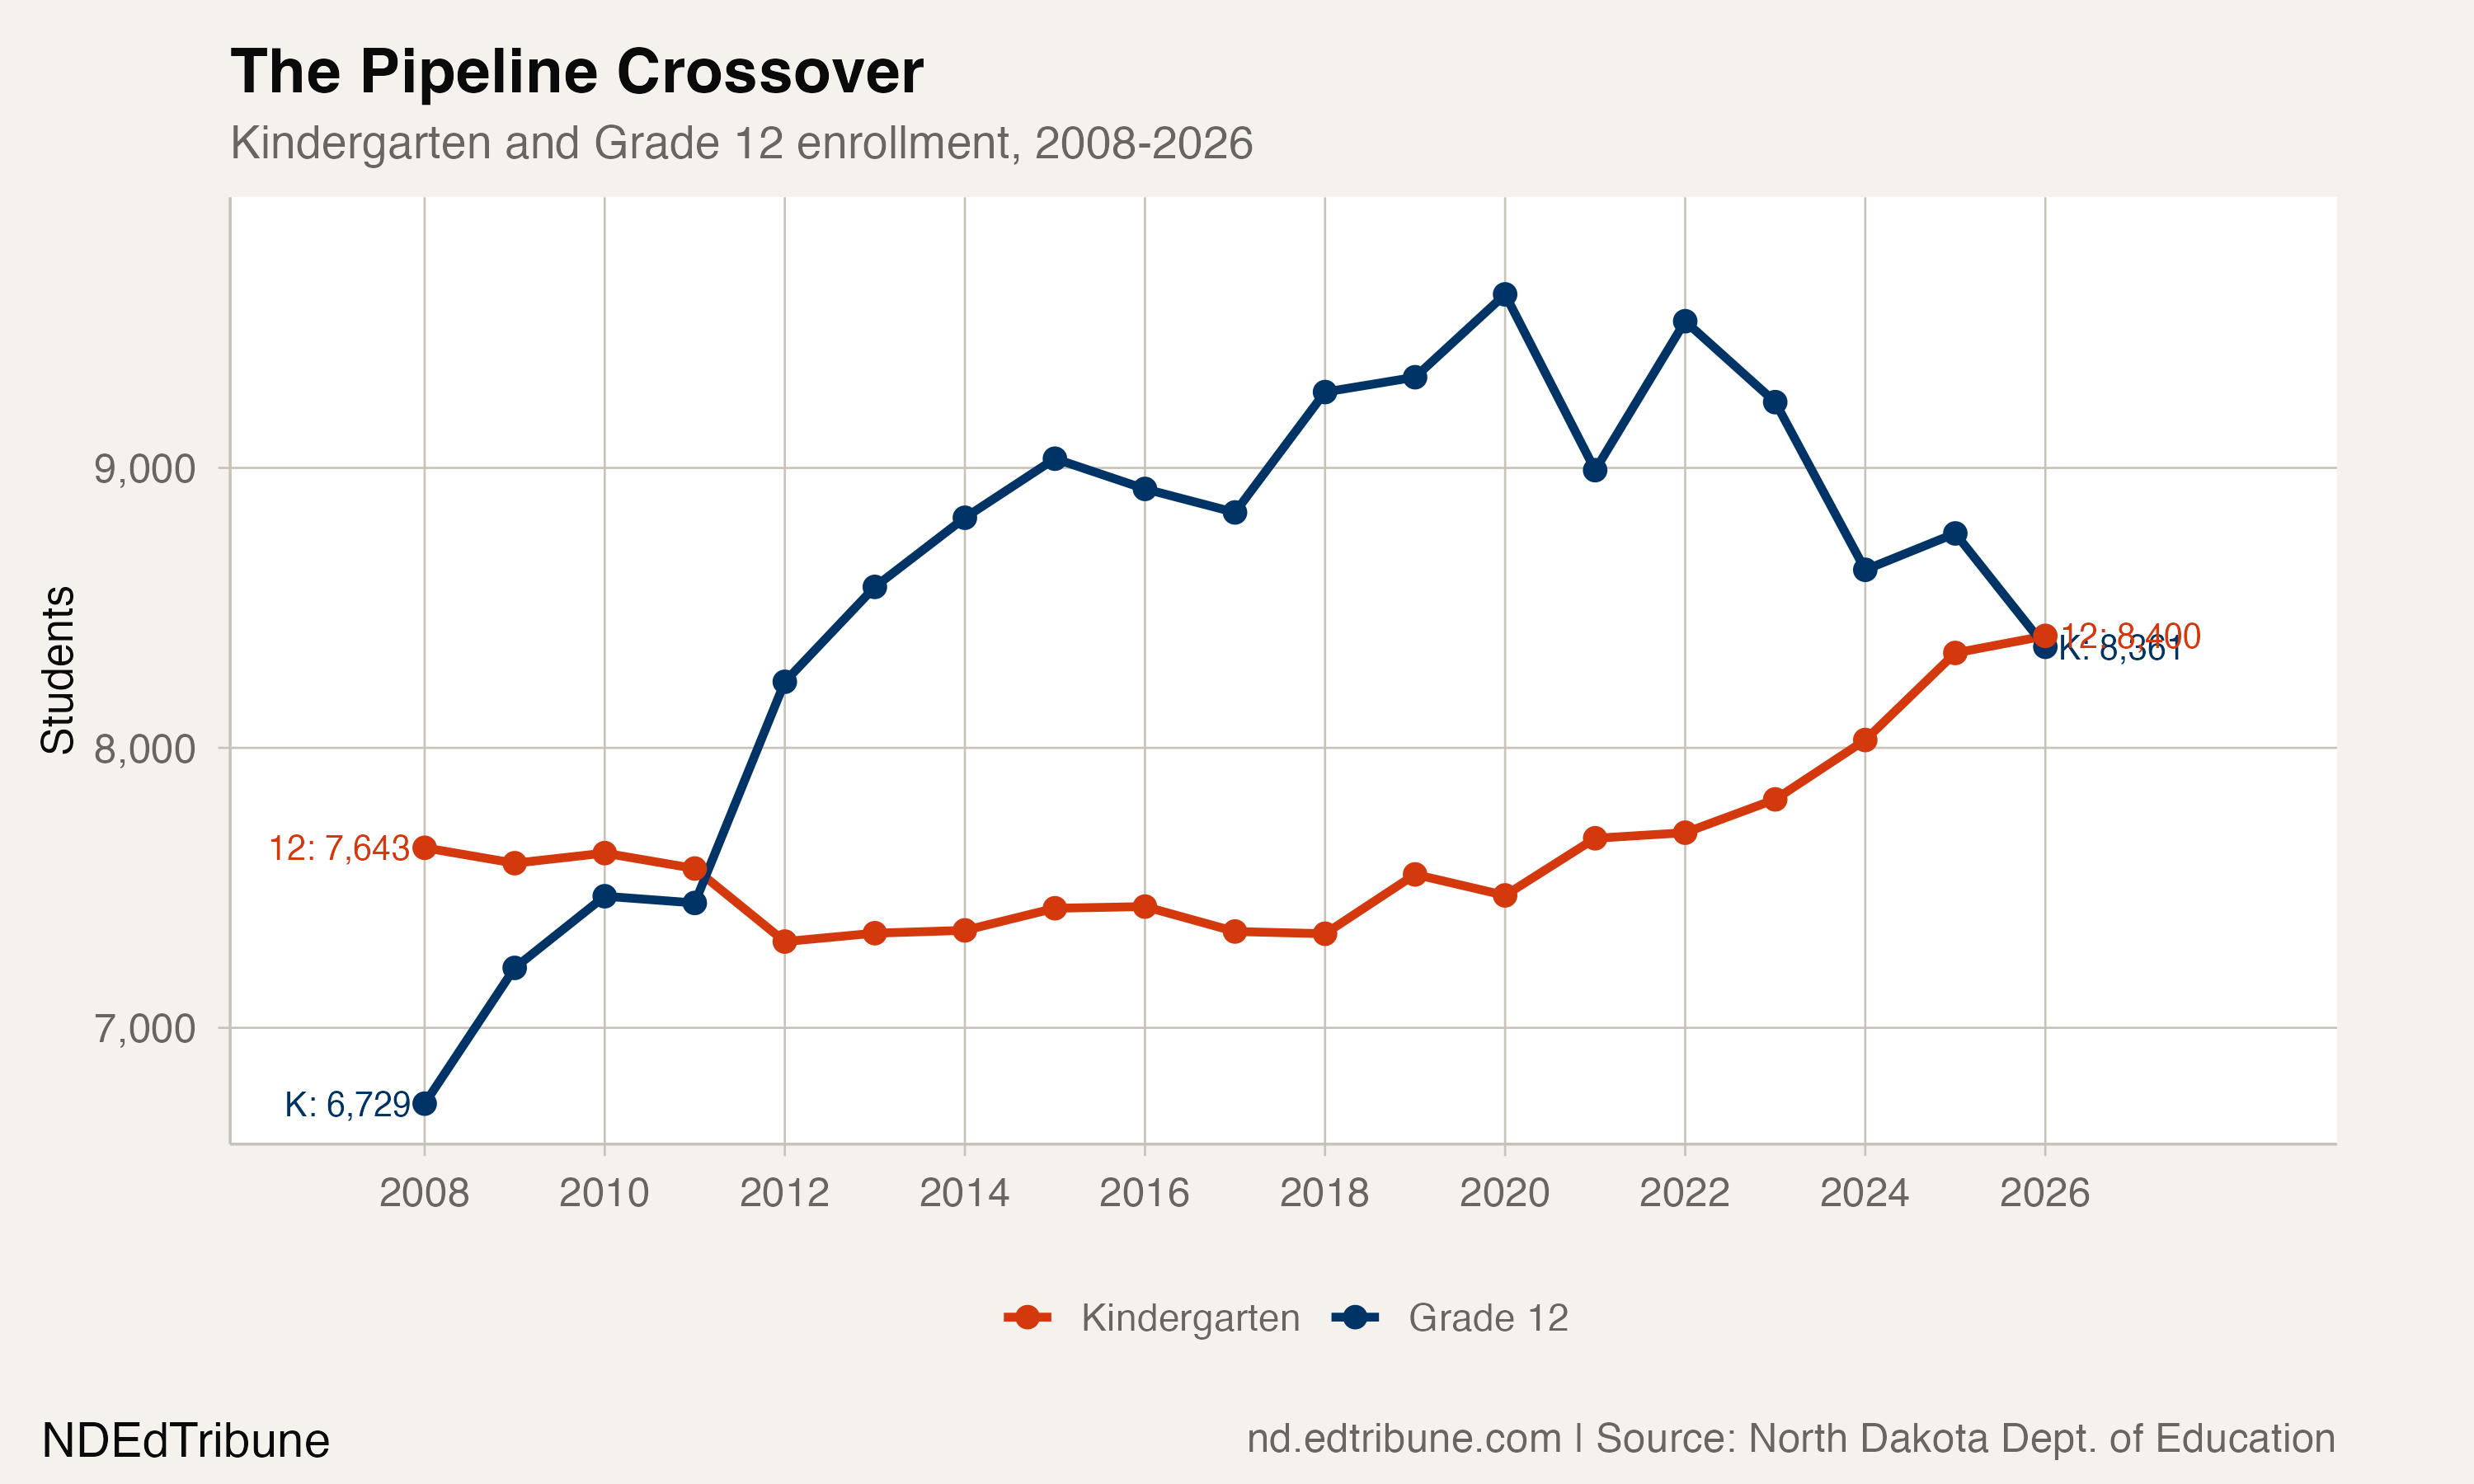
Kindergarten peaked at 9,620 in 2020 and has dropped 13.1% since. Grade 12 has climbed steadily as larger cohorts born during the early Bakken boom work through the system. The crossover happened for the first time since 2011, and the arithmetic is unforgiving: when the entering class is smaller than the graduating one, total enrollment shrinks unless in-migration fills the gap.
North Dakota's birth count has tracked a similar curve. Annual births peaked above 11,000 during 2014-2016, when oil activity drew young families to the state, and have since fallen to roughly 9,592 in 2024. Those smaller cohorts are now arriving at kindergarten.
Three forces behind the gap
No single factor explains the 6,336-student shortfall, but three stand out.
The most direct is the Bakken production cycle. North Dakota's enrollment boom tracked the oil boom almost year for year. The sharpest enrollment gains (3,414 in 2013, 2,622 in 2015) came at peak drilling activity. Now the formation is maturing. Rig counts dropped from about 35 in January 2025 to roughly 30 by mid-year, and Continental Resources, the state's second-largest producer, announced it would halt all North Dakota drilling for the first time in 30 years, citing breakeven prices of $50 to $65 per barrel in a lower-price environment.
"There's a lot of spare capacity on that pipe. It's flowing pretty empty." Gage Dwan, energy analyst at East Daley Analytics, on the Dakota Access Pipeline's declining flows
Fewer drilling jobs means fewer transient families in western North Dakota, and that hits enrollment directly in districts like Dickinson, Stanley, and Minot.
The second force is the homeschool exodus. North Dakota's homeschool enrollment climbed to 5,953 students in 2025-26, a 73% increase since 2019-20 and a 19% jump in the most recent year alone. That roughly 2,500-student increase since the pandemic accounts for about 40% of the statewide gap, though the relationship is not one-to-one: some homeschool families would not have enrolled in public schools regardless.
The third is falling birth rates, a trend that is national in scope. North Dakota's total population continues to grow, reaching 799,358 in 2025 on the strength of in-migration. But growth is concentrated among working-age adults and retirees, not school-age children. The share of residents 65 and older has climbed to 17.3%, while kindergarten classes shrink.
The gap matters because it compounds
A 6,336-student shortfall is not just an abstract comparison to a trend line. At $11,349 per pupil, it means $71.9 million in annual state foundation aid that districts would have received under the pre-COVID trajectory. Over six years, the cumulative shortfall is nearly 20,000 student-years, or $225.9 million in foregone funding.
That fiscal pressure stacks on top of another post-pandemic reality. Chronic absenteeism in North Dakota rose from 12% to 20% of students between 2019 and 2024, and the state received $474 million in pandemic relief at about $4,200 per student, well above the national average of $3,700. That federal money has expired. The students it was meant to recover have not all returned.
No North Dakota district has fully recovered to 2019 achievement levels in either math or reading, according to the Education Recovery Scorecard. The state ranks 12th nationally in math recovery but 33rd in reading. Fewer students and weaker outcomes make every per-pupil dollar count more.
$71.9 million and counting
The 6,336-student gap is not an abstract comparison to a line on a chart. It is $71.9 million in annual per-pupil funding that districts would have received under the pre-COVID trajectory. Minot, which accounts for 1,348 of those missing students, has already posted a $401,265 budget deficit for 2025-26. Jamestown, 269 students below its 2008 level, is studying which of its elementary buildings to close before the general fund runs out in 2029-30.
Governor Armstrong's veto of the ESA/voucher bill kept a potential new enrollment drain off the table. The charter school law passed the same session could introduce another. But neither policy created the gap. The gap is 6,336 families who were supposed to show up, by the standards of the state's own growth trajectory, and did not.
Detailed code that reproduces the analysis and figures in this article is available exclusively to EdTribune subscribers.
Discussion
Sign in to join the discussion.
Loading comments...